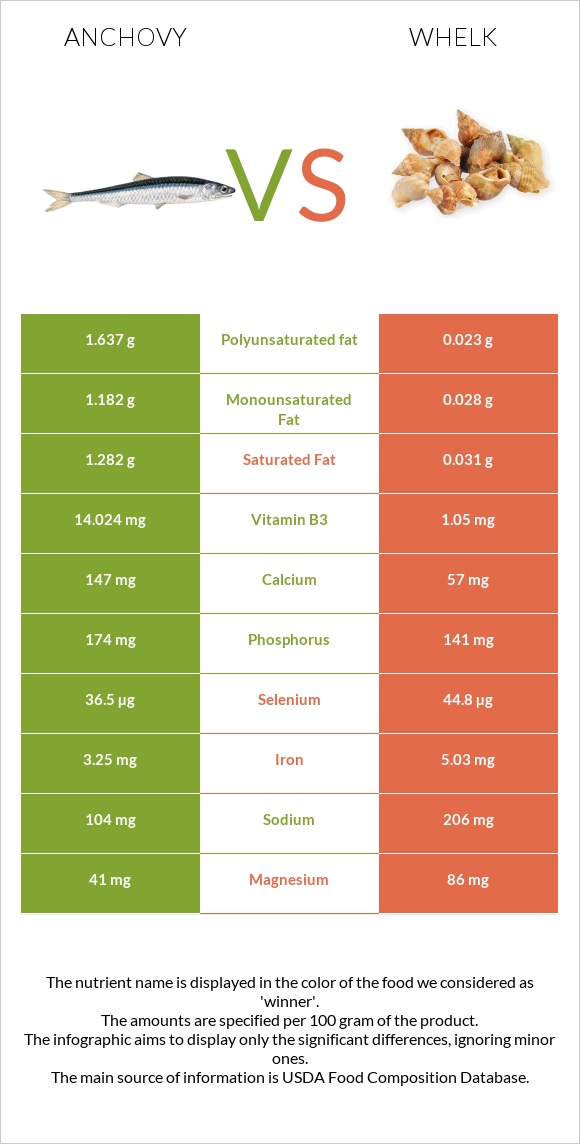
How are anchovies and whelk different? Anchovies are higher in vitamin B3; however, whelk is richer in vitamin B12, copper, selenium, iron, vitamin B6, manganese, magnesium, and phosphorus. Daily need coverage for vitamin B12 for whelk is 730% higher. Anchovies contain 7 times more vitamin B3 than whelk. While anchovies contain 14.024mg of vitamin B3, whelk contains only 1.995mg. Anchovies have less cholesterol. Fish, anchovy, european, raw and Mollusks, whelk, unspecified, cooked, moist heat are the varieties used in this article.
Infographic
Mineral Comparison
Mineral comparison score is based on the number of minerals by which one or the other food is richer. The "coverage" charts below show how much of the daily needs can be covered by 300 grams of the food.
2
100 g
300 g
3 oz - 85g
Magnesium
Magnesium
Calcium
Calcium
Potassium
Potassium
Iron
Iron
Copper
Copper
Zinc
Zinc
Phosphorus
Phosphorus
Sodium
Sodium
Manganese
Manganese
Selenium
Selenium
29%
44%
34%
122%
70%
47%
75%
14%
9.1%
199%
8
100 g
300 g
3 oz - 85g
Magnesium
Magnesium
Calcium
Calcium
Potassium
Potassium
Iron
Iron
Copper
Copper
Zinc
Zinc
Phosphorus
Phosphorus
Sodium
Sodium
Manganese
Manganese
Selenium
Selenium
123%
34%
61%
377%
687%
89%
121%
54%
116%
489%
Vitamin Comparison
Vitamin comparison score is based on the number of vitamins by which one or the other food is richer. The "coverage" charts below show how much of the daily needs can be covered by 300 grams of the food.
6
100 g
300 g
3 oz - 85g
Vitamin C
Vit. C
Vitamin D
Vit. D
Vitamin A
Vit. A
Vitamin E
Vit. E
Vitamin B1
Vit. B1
Vitamin B2
Vit. B2
Vitamin B3
Vit. B3
Vitamin B5
Vit. B5
Vitamin B6
Vit. B6
Vitamin B12
Vit. B12
Vitamin K
Vit. K
Folate
Folate
0%
0%
5%
11%
14%
59%
263%
39%
33%
78%
0.25%
6.8%
5
100 g
300 g
3 oz - 85g
Vitamin C
Vit. C
Vitamin D
Vit. D
Vitamin A
Vit. A
Vitamin E
Vit. E
Vitamin B1
Vit. B1
Vitamin B2
Vit. B2
Vitamin B3
Vit. B3
Vitamin B5
Vit. B5
Vitamin B6
Vit. B6
Vitamin B12
Vit. B12
Vitamin K
Vit. K
Folate
Folate
23%
0%
16%
0%
12%
49%
37%
24%
150%
2268%
0%
8.3%
All nutrients comparison - raw data values
Nutrient
DV% diff.
Vitamin B12
0.62µg
18.14µg
730%
Copper
0.211mg
2.06mg
205%
Selenium
36.5µg
89.6µg
97%
Iron
3.25mg
10.06mg
85%
Vitamin B3
14.024mg
1.995mg
75%
Protein
20.35g
47.68g
55%
Vitamin B6
0.143mg
0.65mg
39%
Manganese
0.07mg
0.89mg
36%
Magnesium
41mg
172mg
31%
Cholesterol
60mg
130mg
23%
Phosphorus
174mg
282mg
15%
Zinc
1.72mg
3.26mg
14%
Sodium
104mg
412mg
13%
Polyunsaturated fat
1.637g
0.046g
11%
Potassium
383mg
694mg
9%
Vitamin C
0mg
6.8mg
8%
Calories
131kcal
275kcal
7%
Fats
4.84g
0.8g
6%
Saturated fat
1.282g
0.062g
6%
Carbs
0g
15.52g
5%
Vitamin B5
0.645mg
0.4mg
5%
Vitamin A
15µg
49µg
4%
Vitamin E
0.57mg
4%
Calcium
147mg
113mg
3%
Vitamin B2
0.256mg
0.214mg
3%
Monounsaturated fat
1.182g
0.056g
3%
Vitamin B1
0.055mg
0.049mg
1%
Folate
9µg
11µg
1%
Protein per 100 calories
16g
17g
N/A
Calories per 10 g protein
64kcal
58kcal
N/A
Weight per 100 calories
76g
36g
N/A
Unsaturated / Saturated Fat ratio
2.2
1.6
N/A
Net carbs
0g
15.52g
N/A
Vitamin K
0.1µg
0%
Tryptophan
0.228mg
0.618mg
0%
Threonine
0.892mg
2.136mg
0%
Isoleucine
0.938mg
1.655mg
0%
Leucine
1.654mg
3.807mg
0%
Lysine
1.869mg
2.93mg
0%
Methionine
0.602mg
1.205mg
0%
Phenylalanine
0.794mg
1.648mg
0%
Valine
1.048mg
2.075mg
0%
Histidine
0.599mg
0.977mg
0%
Omega-3 - EPA
0.538g
0.008g
N/A
Omega-3 - DHA
0.911g
0.012g
N/A
Omega-3 - DPA
0.029g
N/A
Macronutrient Comparison
Macronutrient breakdown side-by-side comparison
2
20%
5%
73%
Protein:
20.35 g
Fats:
4.84 g
Carbs:
0 g
Water:
73.37 g
Other:
1.44 g
3
48%
16%
32%
4%
Protein:
47.68 g
Fats:
0.8 g
Carbs:
15.52 g
Water:
32 g
Other:
4 g
Contains
more
Fats Fats
+505%
Contains
more
Water Water
+129.3%
Contains
more
Protein Protein
+134.3%
Contains
more
Carbs Carbs
+∞%
Contains
more
Other Other
+177.8%
Fat Type Comparison
Fat type breakdown side-by-side comparison
2
31%
29%
40%
Saturated fat:
Sat. Fat
1.282 g
Monounsaturated fat:
Mono. Fat
1.182 g
Polyunsaturated fat:
Poly. Fat
1.637 g
1
38%
34%
28%
Saturated fat:
Sat. Fat
0.062 g
Monounsaturated fat:
Mono. Fat
0.056 g
Polyunsaturated fat:
Poly. Fat
0.046 g
Contains
more
Mono. Fat Monounsaturated fat
+2010.7%
Contains
more
Poly. Fat Polyunsaturated fat
+3458.7%
Contains
less
Sat. Fat Saturated fat
-95.2%