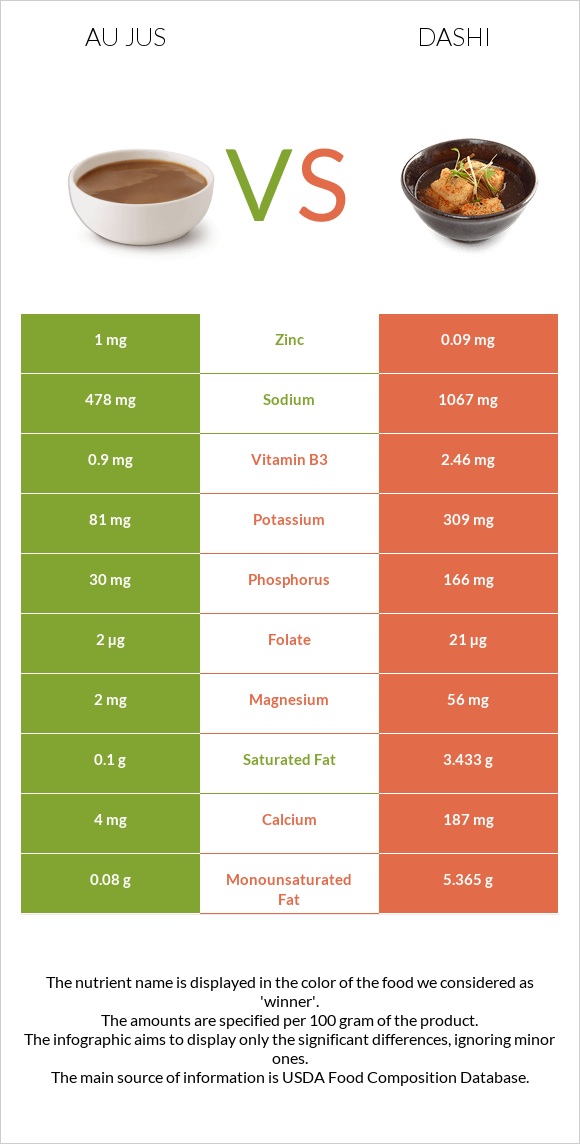
A recap on the differences between au jus and dashi Au jus has more copper; however, dashi is higher in selenium, vitamin B2, phosphorus, calcium, magnesium, vitamin A, and vitamin B3. Dashi covers your daily selenium needs 49% more than au jus. Au jus has less sodium. Food varieties used in this article are Gravy, au jus, canned and Soup, bouillon cubes, and granules, low sodium, dry .
Infographic
Mineral Comparison
Mineral comparison score is based on the number of minerals by which one or the other food is richer. The "coverage" charts below show how much of the daily needs can be covered by 300 grams of the food.
4
100 g
300 g
0.25 cup - 59g 1 can - 298g
Magnesium
Magnesium
Calcium
Calcium
Potassium
Potassium
Iron
Iron
Copper
Copper
Zinc
Zinc
Phosphorus
Phosphorus
Sodium
Sodium
Manganese
Manganese
Selenium
Selenium
1.4%
1.2%
7.1%
23%
33%
27%
13%
62%
26%
2.2%
6
100 g
300 g
1 tsp - 2.6g 1 cube - 3.6g
Magnesium
Magnesium
Calcium
Calcium
Potassium
Potassium
Iron
Iron
Copper
Copper
Zinc
Zinc
Phosphorus
Phosphorus
Sodium
Sodium
Manganese
Manganese
Selenium
Selenium
40%
56%
27%
39%
0%
2.5%
71%
139%
0%
151%
Vitamin Comparison
Vitamin comparison score is based on the number of vitamins by which one or the other food is richer. The "coverage" charts below show how much of the daily needs can be covered by 300 grams of the food.
1
100 g
300 g
0.25 cup - 59g 1 can - 298g
Vitamin C
Vit. C
Vitamin D
Vit. D
Vitamin A
Vit. A
Vitamin E
Vit. E
Vitamin B1
Vit. B1
Vitamin B2
Vit. B2
Vitamin B3
Vit. B3
Vitamin B5
Vit. B5
Vitamin B6
Vit. B6
Vitamin B12
Vit. B12
Vitamin K
Vit. K
Folate
Folate
3.3%
0%
0%
0%
5%
14%
17%
1.2%
2.3%
13%
0%
1.5%
9
100 g
300 g
1 tsp - 2.6g 1 cube - 3.6g
Vitamin C
Vit. C
Vitamin D
Vit. D
Vitamin A
Vit. A
Vitamin E
Vit. E
Vitamin B1
Vit. B1
Vitamin B2
Vit. B2
Vitamin B3
Vit. B3
Vitamin B5
Vit. B5
Vitamin B6
Vit. B6
Vitamin B12
Vit. B12
Vitamin K
Vit. K
Folate
Folate
3.7%
0%
8.3%
14%
25%
99%
46%
0%
23%
38%
167%
16%
All nutrients comparison - raw data values
Nutrient
DV% diff.
Vitamin K
66.9µg
56%
Selenium
0.4µg
27.6µg
49%
Protein
1.2g
16.7g
31%
Polyunsaturated fat
0.01g
4.485g
30%
Vitamin B2
0.06mg
0.43mg
28%
Sodium
478mg
1067mg
26%
Calories
16kcal
438kcal
21%
Fats
0.2g
13.89g
21%
Carbs
2.5g
64.88g
21%
Choline
114.5mg
21%
Phosphorus
30mg
166mg
19%
Calcium
4mg
187mg
18%
Saturated fat
0.1g
3.433g
15%
Magnesium
2mg
56mg
13%
Monounsaturated fat
0.08g
5.365g
13%
Copper
0.1mg
0mg
11%
Vitamin B3
0.9mg
2.46mg
10%
Manganese
0.2mg
9%
Zinc
1mg
0.09mg
8%
Vitamin B12
0.1µg
0.3µg
8%
Potassium
81mg
309mg
7%
Vitamin B1
0.02mg
0.1mg
7%
Vitamin B6
0.01mg
0.1mg
7%
Iron
0.6mg
1.03mg
5%
Vitamin E
0.72mg
5%
Folate
2µg
21µg
5%
Cholesterol
0mg
13mg
4%
Vitamin A
0µg
25µg
3%
Fiber
0g
0.2g
1%
Protein per 100 calories
7.5g
3.8g
N/A
Calories per 10 g protein
133kcal
262kcal
N/A
Weight per 100 calories
625g
23g
N/A
Unsaturated / Saturated Fat ratio
0.9
2.9
N/A
Vitamin C
1mg
1.1mg
0%
Net carbs
2.5g
64.68g
N/A
Sugar
14.47g
N/A
Vitamin B5
0.02mg
0%
Macronutrient Comparison
Macronutrient breakdown side-by-side comparison
1
3%
95%
Protein:
1.2 g
Fats:
0.2 g
Carbs:
2.5 g
Water:
94.5 g
Other:
1.6 g
4
17%
14%
65%
2%
2%
Protein:
16.7 g
Fats:
13.89 g
Carbs:
64.88 g
Water:
2.3 g
Other:
2.23 g
Contains
more
Water Water
+4008.7%
Contains
more
Protein Protein
+1291.7%
Contains
more
Fats Fats
+6845%
Contains
more
Carbs Carbs
+2495.2%
Contains
more
Other Other
+39.4%
Fat Type Comparison
Fat type breakdown side-by-side comparison
1
53%
42%
5%
Saturated fat:
Sat. Fat
0.1 g
Monounsaturated fat:
Mono. Fat
0.08 g
Polyunsaturated fat:
Poly. Fat
0.01 g
2
26%
40%
34%
Saturated fat:
Sat. Fat
3.433 g
Monounsaturated fat:
Mono. Fat
5.365 g
Polyunsaturated fat:
Poly. Fat
4.485 g
Contains
less
Sat. Fat Saturated fat
-97.1%
Contains
more
Mono. Fat Monounsaturated fat
+6606.3%
Contains
more
Poly. Fat Polyunsaturated fat
+44750%