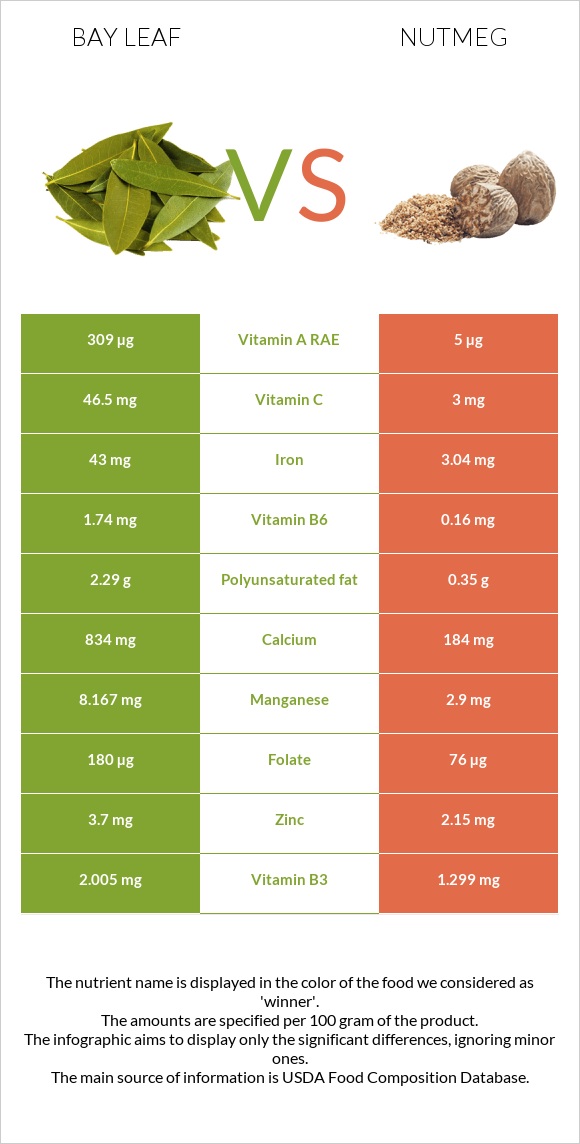
How are bay leaf and nutmeg different? Bay leaf is higher in iron, manganese, vitamin A, vitamin B6, calcium, vitamin C, and vitamin B2; however, nutmeg is richer in copper and vitamin B1. Daily need coverage for iron for bay leaf is 500% higher. Bay leaf contains 61 times more vitamin A than nutmeg. While bay leaf contains 6185 IU of vitamin A, nutmeg contains only 102 IU. Bay leaf has less saturated fat. Spices, bay leaf and Spices, nutmeg, ground are the varieties used in this article.
Infographic
Mineral Comparison
Mineral comparison score is based on the number of minerals by which one or the other food is richer. The "coverage" charts below show how much of the daily needs can be covered by 300 grams of the food.
6
100 g
300 g
1 tsp, crumbled - 0.6g 1 tbsp, crumbled - 1.8g
Magnesium
Magnesium
Calcium
Calcium
Potassium
Potassium
Iron
Iron
Copper
Copper
Zinc
Zinc
Phosphorus
Phosphorus
Sodium
Sodium
Manganese
Manganese
Selenium
Selenium
86%
250%
47%
1613%
139%
101%
48%
3%
1065%
15%
4
100 g
300 g
0.25 tsp - 0.5g 1 tbsp - 7g
Magnesium
Magnesium
Calcium
Calcium
Potassium
Potassium
Iron
Iron
Copper
Copper
Zinc
Zinc
Phosphorus
Phosphorus
Sodium
Sodium
Manganese
Manganese
Selenium
Selenium
131%
55%
31%
114%
342%
59%
91%
2.1%
378%
8.7%
Vitamin Comparison
Vitamin comparison score is based on the number of vitamins by which one or the other food is richer. The "coverage" charts below show how much of the daily needs can be covered by 300 grams of the food.
6
100 g
300 g
1 tsp, crumbled - 0.6g 1 tbsp, crumbled - 1.8g
Vitamin C
Vit. C
Vitamin D
Vit. D
Vitamin A
Vit. A
Vitamin E
Vit. E
Vitamin B1
Vit. B1
Vitamin B2
Vit. B2
Vitamin B3
Vit. B3
Vitamin B5
Vit. B5
Vitamin B6
Vit. B6
Vitamin B12
Vit. B12
Vitamin K
Vit. K
Folate
Folate
155%
0%
103%
0%
2.3%
97%
38%
0%
402%
0%
0%
135%
1
100 g
300 g
0.25 tsp - 0.5g 1 tbsp - 7g
Vitamin C
Vit. C
Vitamin D
Vit. D
Vitamin A
Vit. A
Vitamin E
Vit. E
Vitamin B1
Vit. B1
Vitamin B2
Vit. B2
Vitamin B3
Vit. B3
Vitamin B5
Vit. B5
Vitamin B6
Vit. B6
Vitamin B12
Vit. B12
Vitamin K
Vit. K
Folate
Folate
10%
0%
1.7%
0%
87%
13%
24%
0%
37%
0%
0%
57%
All nutrients comparison - raw data values
Nutrient
DV% diff.
Iron
43mg
3.04mg
500%
Manganese
8.167mg
2.9mg
229%
Vitamin B6
1.74mg
0.16mg
122%
Saturated fat
2.28g
25.94g
108%
Copper
0.416mg
1.027mg
68%
Calcium
834mg
184mg
65%
Vitamin C
46.5mg
3mg
48%
Fats
8.36g
36.31g
43%
Vitamin A
309µg
5µg
34%
Vitamin B1
0.009mg
0.346mg
28%
Vitamin B2
0.421mg
0.057mg
28%
Folate
180µg
76µg
26%
Fiber
26.3g
20.8g
22%
Magnesium
120mg
183mg
15%
Zinc
3.7mg
2.15mg
14%
Phosphorus
113mg
213mg
14%
Polyunsaturated fat
2.29g
0.35g
13%
Calories
313kcal
525kcal
11%
Carbs
74.97g
49.29g
9%
Potassium
529mg
350mg
5%
Protein
7.61g
5.84g
4%
Vitamin B3
2.005mg
1.299mg
4%
Monounsaturated fat
1.64g
3.22g
4%
Selenium
2.8µg
1.6µg
2%
Choline
8.8mg
2%
Protein per 100 calories
2.4g
1.1g
N/A
Calories per 10 g protein
411kcal
899kcal
N/A
Weight per 100 calories
32g
19g
N/A
Unsaturated / Saturated Fat ratio
1.7
0.14
N/A
Net carbs
48.67g
28.49g
N/A
Sugar
2.99g
N/A
Sodium
23mg
16mg
0%
Macronutrient Comparison
Macronutrient breakdown side-by-side comparison
3
8%
8%
75%
5%
4%
Protein:
7.61 g
Fats:
8.36 g
Carbs:
74.97 g
Water:
5.44 g
Other:
3.62 g
2
6%
36%
49%
6%
2%
Protein:
5.84 g
Fats:
36.31 g
Carbs:
49.29 g
Water:
6.23 g
Other:
2.33 g
Contains
more
Protein Protein
+30.3%
Contains
more
Carbs Carbs
+52.1%
Contains
more
Other Other
+55.4%
Contains
more
Fats Fats
+334.3%
Contains
more
Water Water
+14.5%
Fat Type Comparison
Fat type breakdown side-by-side comparison
2
37%
26%
37%
Saturated fat:
Sat. Fat
2.28 g
Monounsaturated fat:
Mono. Fat
1.64 g
Polyunsaturated fat:
Poly. Fat
2.29 g
1
88%
11%
Saturated fat:
Sat. Fat
25.94 g
Monounsaturated fat:
Mono. Fat
3.22 g
Polyunsaturated fat:
Poly. Fat
0.35 g
Contains
less
Sat. Fat Saturated fat
-91.2%
Contains
more
Poly. Fat Polyunsaturated fat
+554.3%
Contains
more
Mono. Fat Monounsaturated fat
+96.3%