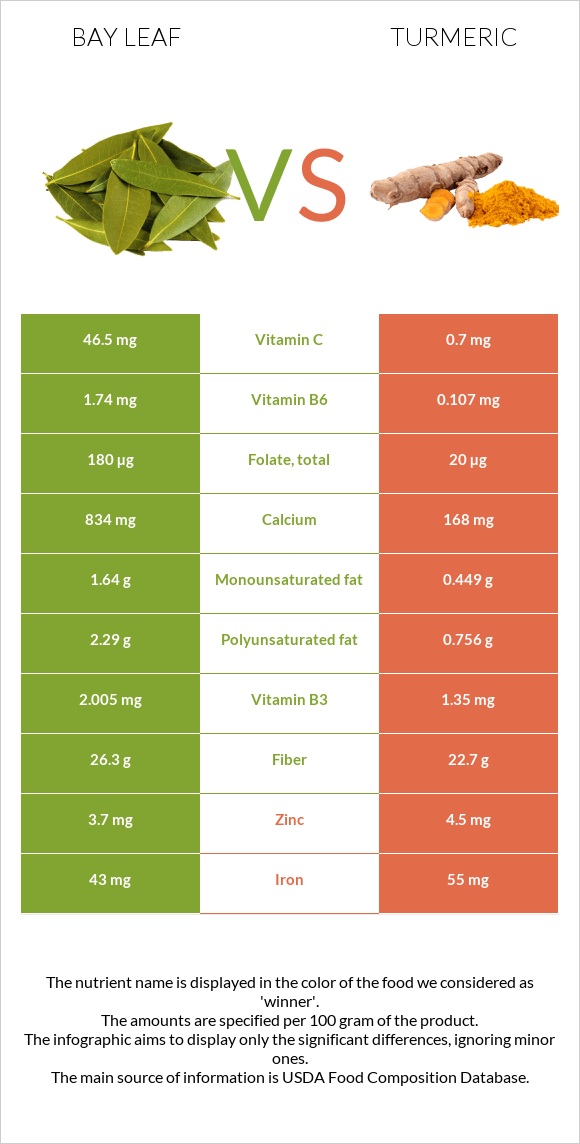
What are the differences between bay leaf and turmeric? Bay leaf is higher in vitamin B6, vitamin A, calcium, vitamin C, and folate, yet turmeric is higher in manganese, iron, copper, potassium, and phosphorus. Turmeric's daily need coverage for manganese is 506% more. We used Spices, bay leaf and Spices, turmeric, ground types in this article.
Infographic
Mineral Comparison
Mineral comparison score is based on the number of minerals by which one or the other food is richer. The "coverage" charts below show how much of the daily needs can be covered by 300 grams of the food.
2
100 g
300 g
1 tsp, crumbled - 0.6g 1 tbsp, crumbled - 1.8g
Magnesium
Magnesium
Calcium
Calcium
Potassium
Potassium
Iron
Iron
Copper
Copper
Zinc
Zinc
Phosphorus
Phosphorus
Sodium
Sodium
Manganese
Manganese
Selenium
Selenium
86%
250%
47%
1613%
139%
101%
48%
3%
1065%
15%
8
100 g
300 g
0.25 tsp - 0.5g 1 tbsp - 9.4g
Magnesium
Magnesium
Calcium
Calcium
Potassium
Potassium
Iron
Iron
Copper
Copper
Zinc
Zinc
Phosphorus
Phosphorus
Sodium
Sodium
Manganese
Manganese
Selenium
Selenium
149%
50%
184%
2063%
433%
123%
128%
3.5%
2583%
34%
Vitamin Comparison
Vitamin comparison score is based on the number of vitamins by which one or the other food is richer. The "coverage" charts below show how much of the daily needs can be covered by 300 grams of the food.
6
100 g
300 g
1 tsp, crumbled - 0.6g 1 tbsp, crumbled - 1.8g
Vitamin C
Vit. C
Vitamin D
Vit. D
Vitamin A
Vit. A
Vitamin E
Vit. E
Vitamin B1
Vit. B1
Vitamin B2
Vit. B2
Vitamin B3
Vit. B3
Vitamin B5
Vit. B5
Vitamin B6
Vit. B6
Vitamin B12
Vit. B12
Vitamin K
Vit. K
Folate
Folate
155%
0%
103%
0%
2.3%
97%
38%
0%
402%
0%
0%
135%
4
100 g
300 g
0.25 tsp - 0.5g 1 tbsp - 9.4g
Vitamin C
Vit. C
Vitamin D
Vit. D
Vitamin A
Vit. A
Vitamin E
Vit. E
Vitamin B1
Vit. B1
Vitamin B2
Vit. B2
Vitamin B3
Vit. B3
Vitamin B5
Vit. B5
Vitamin B6
Vit. B6
Vitamin B12
Vit. B12
Vitamin K
Vit. K
Folate
Folate
2.3%
0%
0%
89%
15%
35%
25%
33%
25%
0%
34%
15%
All nutrients comparison - raw data values
Nutrient
DV% diff.
Manganese
8.167mg
19.8mg
506%
Iron
43mg
55mg
150%
Vitamin B6
1.74mg
0.107mg
126%
Copper
0.416mg
1.3mg
98%
Calcium
834mg
168mg
67%
Vitamin C
46.5mg
0.7mg
51%
Potassium
529mg
2080mg
46%
Folate
180µg
20µg
40%
Vitamin A
309µg
0µg
34%
Vitamin E
4.43mg
30%
Phosphorus
113mg
299mg
27%
Magnesium
120mg
208mg
21%
Vitamin B2
0.421mg
0.15mg
21%
Fiber
26.3g
22.7g
14%
Vitamin B5
0.542mg
11%
Vitamin K
13.4µg
11%
Polyunsaturated fat
2.29g
0.756g
10%
Choline
49.2mg
9%
Fats
8.36g
3.25g
8%
Zinc
3.7mg
4.5mg
7%
Selenium
2.8µg
6.2µg
6%
Protein
7.61g
9.68g
4%
Vitamin B1
0.009mg
0.058mg
4%
Vitamin B3
2.005mg
1.35mg
4%
Carbs
74.97g
67.14g
3%
Monounsaturated fat
1.64g
0.449g
3%
Saturated fat
2.28g
1.838g
2%
Fructose
0.45g
1%
Calories
313kcal
312kcal
0%
Protein per 100 calories
2.4g
3.1g
N/A
Calories per 10 g protein
411kcal
322kcal
N/A
Weight per 100 calories
32g
32g
N/A
Unsaturated / Saturated Fat ratio
1.7
0.66
N/A
Net carbs
48.67g
44.44g
N/A
Sugar
3.21g
N/A
Sodium
23mg
27mg
0%
Trans fat
0g
0.056g
N/A
Tryptophan
0.17mg
0%
Threonine
0.33mg
0%
Isoleucine
0.47mg
0%
Leucine
0.81mg
0%
Lysine
0.38mg
0%
Methionine
0.14mg
0%
Phenylalanine
0.53mg
0%
Valine
0.66mg
0%
Histidine
0.15mg
0%
Omega-3 - ALA
0.003g
N/A
Omega-6 - Gamma-linoleic acid
0.081g
N/A
Macronutrient Comparison
Macronutrient breakdown side-by-side comparison
2
8%
8%
75%
5%
4%
Protein:
7.61 g
Fats:
8.36 g
Carbs:
74.97 g
Water:
5.44 g
Other:
3.62 g
3
10%
3%
67%
13%
7%
Protein:
9.68 g
Fats:
3.25 g
Carbs:
67.14 g
Water:
12.85 g
Other:
7.08 g
Contains
more
Fats Fats
+157.2%
Contains
more
Carbs Carbs
+11.7%
Contains
more
Protein Protein
+27.2%
Contains
more
Water Water
+136.2%
Contains
more
Other Other
+95.6%
Fat Type Comparison
Fat type breakdown side-by-side comparison
2
37%
26%
37%
Saturated fat:
Sat. Fat
2.28 g
Monounsaturated fat:
Mono. Fat
1.64 g
Polyunsaturated fat:
Poly. Fat
2.29 g
1
60%
15%
25%
Saturated fat:
Sat. Fat
1.838 g
Monounsaturated fat:
Mono. Fat
0.449 g
Polyunsaturated fat:
Poly. Fat
0.756 g
Contains
more
Mono. Fat Monounsaturated fat
+265.3%
Contains
more
Poly. Fat Polyunsaturated fat
+202.9%
Contains
less
Sat. Fat Saturated fat
-19.4%