Kidney Beans vs. Pigeon Peas — Health Impact and Nutrition Comparison


Summary
Kidney beans are slightly richer in proteins compared to pigeon peas. The main minerals in both are copper, manganese, iron, phosphorus, and zinc. All are present in similar amounts, but kidney beans have double the amount of iron.
Fresh (immature) pigeon peas can be consumed raw, while matured pigeon peas must be soaked first and then cooked. Like matured pigeon peas, kidney beans cannot be consumed raw and must be soaked first and then cooked. Whereas the color of kidney beans ranges from light to dark red, pigeon peas can be anywhere between green, yellow, to brown. They are also relatively more round than kidney beans.
Introduction
In this article, we will compare two types of legumes: kidney beans and pigeon peas.
We will focus on their nutritional differences and health impacts.
Overview
Appearance
Kidney beans earned their name because they look like mini kidneys. Their color ranges from light to dark red, and there are hence many types of kidney beans, including red kidney beans, white kidney beans, and more. On the other hand, the shape of pigeon peas is more round when compared to kidney beans. Their colors may be green, yellow, or brown depending on how mature the peas are, as well as how they have been cooked.
Taste
The taste of pigeon peas has often been described as nutty and minty, while kidney beans are often described as sweet.
Use
Fresh (immature) pigeon peas can be consumed without cooking. You can add them to salads or eat them as a snack. When matured, pigeon peas should be soaked first in water and then cooked. Just like matured pigeon peas, kidney beans must be soaked before cooking. Pigeon peas are commonly used in soups, sauces, and curries, while kidney beans are very popular in chili and jambalaya.
Nutritional Content Comparison
The average serving size for cooked, boiled legumes is usually ½ of a cup, which is around 80-90 grams.
In this section, we will discuss 100g of each legume. We will consider kidney beans and pigeon peas in cooked forms (boiled with no salt).
It is interesting to note that after cooking, the sizes of kidney beans and pigeon peas increase by approximately three times.
Macronutrients and Calories
Per 100 grams of serving, kidney beans and pigeon peas provide almost equal amounts of calories. Kidney beans provide 127 calories, while pigeon peas provide 121 calories.
As can be seen from the graphs below, the macronutrient composition of kidney beans and pigeon peas are quite similar, with very few differences.
Macronutrient Comparison
Contains
more
ProteinProtein
+28.3%
Contains
more
FatsFats
+31.6%
Proteins
Kidney beans are slightly richer in proteins compared to pigeon peas. Kidney beans contain 8.67g of protein, whereas pigeon peas contain 6.76g.
Carbs
Pigeon peas and kidney beans contain similar amounts of carbs. Per 100-gram serving, pigeon peas contain 16.55 grams of protein, while kidney beans contain 16.4 grams.
Fiber
Pigeon peas and kidney beans contain similar amounts of fiber as well. Per 100-gram serving, there are 6.4 grams of fiber in kidney beans, while the same serving of pigeon peas contains 6.7 grams. Given that the daily need for fiber is around 25-30 grams, both are great sources of fiber.
Fats
The amount of total fat in both kidney beans and pigeon peas is negligible. Pigeon peas contain 0.38g, whereas kidney beans contain 0.5g.
From the fat-type comparison chart below, you can see that pigeon peas and kidney beans have similar amounts of polyunsaturated fats; however, kidney beans have more monounsaturated fats, while pigeon peas have more saturated fat.
Fat Type Comparison
Contains
less
Sat. FatSaturated fat
-12%
Contains
more
Mono. FatMonounsaturated fat
+1200%
Contains
more
Poly. FatPolyunsaturated fat
+35.6%
Minerals
Kidney beans and pigeon peas are packed with various minerals to help you fill up your daily need.
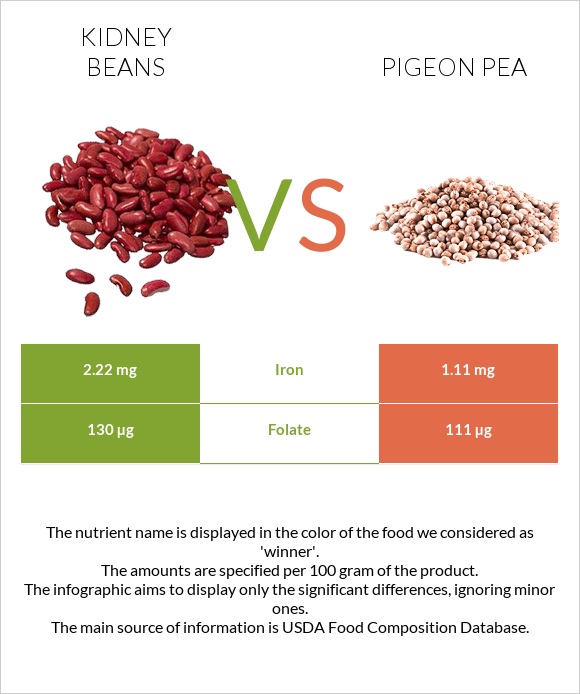
The main minerals in both are copper, manganese, iron, phosphorus, and zinc. All are in similar amounts in both, but kidney beans have double the amount of iron. If we look at the small differences, kidney beans have slightly more phosphors and zinc, while pigeon peas have slightly more copper and manganese.
In the diagrams below, we can visualize the mineral distributions.
Mineral Comparison
Contains
more
IronIron
+100%
Contains
more
PhosphorusPhosphorus
+16%
Contains
less
SodiumSodium
-80%
Contains
more
CalciumCalcium
+22.9%
Contains
more
CopperCopper
+24.5%
Contains
more
ManganeseManganese
+16.5%
Contains
more
SeleniumSelenium
+163.6%
Vitamins
The two most prevalent vitamins found in both kidney beans and pigeon peas are folate and vitamin B1. They are present in both in similar amounts.
Per 100 grams of kidney beans, you receive 130µg of folate, while for pigeon peas, it is a little lower and equals 111µg.
A single serving of neither of these legumen provides any other significant amounts of vitamins; however, we can still compare the little amounts that they do provide. Kidney beans have slightly more vitamin B5, vitamin B6, vitamin K, and vitamin C, while pigeon peas provide slightly more vitamin B5 and vitamin B3.
In the diagrams below, we can visualize the vitamin distributions.
Vitamin Comparison
Contains
more
Vitamin CVitamin C
+∞%
Contains
more
Vitamin EVitamin E
+∞%
Contains
more
Vitamin B6Vitamin B6
+140%
Contains
more
Vitamin KVitamin K
+∞%
Contains
more
FolateFolate
+17.1%
Contains
more
Vitamin B3Vitamin B3
+35.1%
Contains
more
Vitamin B5Vitamin B5
+45%
Glycemic Index
The glycemic index is a rating system used for foods containing carbohydrates. As both kidney beans and pigeon peas have a glycemic index of 22, they are both considered low-GI foods.
Acidity
One way to understand the acidity of foods is through their potential renal acid load (PRAL) value, which shows how much acid or base the given food produces inside the organism.
Based on our calculations, the PRAL value of kidney beans is -0.7, while the PRAL value for pigeon peas is -2.1, which means both are alkaline.
Health Impact
This section will highlight the different health impacts each legume provides. Although several common ones exist, we will only discuss the different health impacts.
Both kidney beans and pigeon peas are rich in fiber, decreasing the risks of gastrointestinal diseases such as diverticulitis and chronic constipation. In addition, fiber-rich food improves gut microflora, as well as positively affects cardiovascular health and blood sugar control (1).
While pigeon peas completely lack vitamin K, kidney beans contain little amounts of the vitamin. A diet rich in vitamin K has been linked with decreased cardiovascular mortality risks and reduced arterial calcifications. In addition, it reduces the risks of type 2 diabetes development and osteoporosis. However, while taking anticoagulant medications, vitamin K intake should be monitored (2, 3, 4).
Kidney beans are richer in iron, although pigeon peas do contain the mineral as well. They, however, also contain phytic compounds, which reduce iron absorption (5).
Both also have low amounts of selenium, although pigeon peas are richer. Selenium provides several health benefits to the immune system to fend off viral infections, thyroid hormone regulation, and antioxidative properties against reactive oxygen species (6).
Both pigeon peas and kidney beans also contain some amounts of manganese, which has antioxidative properties and is coenzymes for several metabolic reactions (7).
Pigeon peas and kidney beans are also excellent sources of folate, which reduces the risks of anemia and congenital neural tube defects in babies (8).
Both foods should not be eaten raw because they contain phytic acid and other compounds, which act as anti-foods and reduce the absorption of nutrients. However, after cooking, these compounds get neutralized (5).
References
- https://pubmed.ncbi.nlm.nih.gov/19335713/
- https://pubmed.ncbi.nlm.nih.gov/34439410/
- https://www.ncbi.nlm.nih.gov/pmc/articles/PMC4600246/
- https://pubmed.ncbi.nlm.nih.gov/15825811/
- https://pubmed.ncbi.nlm.nih.gov/35010899/
- https://www.ncbi.nlm.nih.gov/books/NBK557551/
- https://pubmed.ncbi.nlm.nih.gov/30855111/
- https://www.ncbi.nlm.nih.gov/books/NBK535377/

Infographic
All nutrients comparison - raw data values
| Nutrient | |
|
DV% diff. |
| Iron | 2.22mg | 1.11mg | 14% |
| Vitamin K | 8.4µg | 7% | |
| Copper | 0.216mg | 0.269mg | 6% |
| Choline | 30.5mg | 6% | |
| Vitamin B6 | 0.12mg | 0.05mg | 5% |
| Folate | 130µg | 111µg | 5% |
| Protein | 8.67g | 6.76g | 4% |
| Phosphorus | 138mg | 119mg | 3% |
| Manganese | 0.43mg | 0.501mg | 3% |
| Selenium | 1.1µg | 2.9µg | 3% |
| Vitamin B5 | 0.22mg | 0.319mg | 2% |
| Vitamin C | 1.2mg | 0mg | 1% |
| Magnesium | 42mg | 46mg | 1% |
| Calcium | 35mg | 43mg | 1% |
| Potassium | 405mg | 384mg | 1% |
| Fiber | 6.4g | 6.7g | 1% |
| Zinc | 1mg | 0.9mg | 1% |
| Vitamin B1 | 0.16mg | 0.146mg | 1% |
| Vitamin B3 | 0.578mg | 0.781mg | 1% |
| Calories | 127kcal | 121kcal | 0% |
| Protein per 100 calories | 6.8g | 5.6g | N/A |
| Calories per 10 g protein | 146kcal | 179kcal | N/A |
| Weight per 100 calories | 79g | 83g | N/A |
| Fats | 0.5g | 0.38g | 0% |
| Net carbs | 16.4g | 16.55g | N/A |
| Carbs | 22.8g | 23.25g | 0% |
| Sugar | 0.32g | N/A | |
| Sodium | 1mg | 5mg | 0% |
| Vitamin E | 0.03mg | 0% | |
| Vitamin B2 | 0.058mg | 0.059mg | 0% |
| Saturated fat | 0.073g | 0.083g | 0% |
| Monounsaturated fat | 0.039g | 0.003g | 0% |
| Polyunsaturated fat | 0.278g | 0.205g | 0% |
| Tryptophan | 0.104mg | 0.066mg | 0% |
| Threonine | 0.319mg | 0.239mg | 0% |
| Isoleucine | 0.41mg | 0.245mg | 0% |
| Leucine | 0.736mg | 0.483mg | 0% |
| Lysine | 0.607mg | 0.474mg | 0% |
| Methionine | 0.113mg | 0.076mg | 0% |
| Phenylalanine | 0.511mg | 0.579mg | 0% |
| Valine | 0.5mg | 0.292mg | 0% |
| Histidine | 0.238mg | 0.241mg | 0% |
People also compare


References
All the values for which the sources are not specified explicitly are taken from FDA’s Food Central. The exact link to the food presented on this page can be found below.
- Kidney beans - https://fdc.nal.usda.gov/fdc-app.html#/food-details/173740/nutrients
- Pigeon pea - https://fdc.nal.usda.gov/fdc-app.html#/food-details/172437/nutrients
All the Daily Values are presented for males aged 31-50, for 2000-calorie diets.