Green beans vs. Peas — In-Depth Nutrition Comparison
Compare
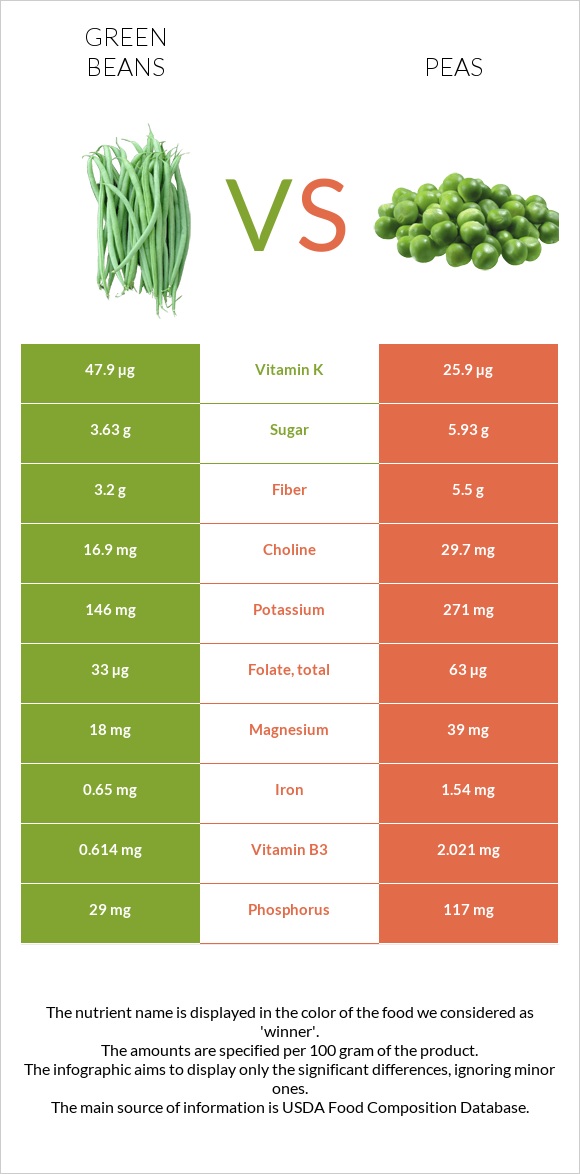
How are green beans and peas different?
- Green beans are richer in vitamin K, while peas are higher in vitamin B5, vitamin B1, copper, phosphorus, vitamin B6, iron, manganese, fiber, and vitamin B3.
- Peas cover your daily need for vitamin B5, 3059% more than green beans.
- Green beans contain 2 times more vitamin K than peas. Green beans contain 47.9µg of vitamin K, while peas contain 25.9µg.
- Peas have a higher glycemic index (54) than green beans (20).
Beans, snap, green, cooked, boiled, drained, without salt and Peas, green, cooked, boiled, drained, without salt types were used in this article.
Infographic
Infographic link
Mineral Comparison
Mineral comparison score is based on the number of minerals by which one or the other food is richer. The "coverage" charts below show how much of the daily needs can be covered by 300 grams of the food.
| Contains more CalciumCalcium | +63% |
| Contains less SodiumSodium | -66.7% |
| Contains more MagnesiumMagnesium | +116.7% |
| Contains more PotassiumPotassium | +85.6% |
| Contains more IronIron | +136.9% |
| Contains more CopperCopper | +203.5% |
| Contains more ZincZinc | +376% |
| Contains more PhosphorusPhosphorus | +303.4% |
| Contains more ManganeseManganese | +84.2% |
| Contains more SeleniumSelenium | +850% |
Vitamin Comparison
Vitamin comparison score is based on the number of vitamins by which one or the other food is richer. The "coverage" charts below show how much of the daily needs can be covered by 300 grams of the food.
| Contains more Vitamin EVitamin E | +228.6% |
| Contains more Vitamin KVitamin K | +84.9% |
| Contains more Vitamin CVitamin C | +46.4% |
| Contains more Vitamin AVitamin A | +25% |
| Contains more Vitamin B1Vitamin B1 | +250% |
| Contains more Vitamin B2Vitamin B2 | +53.6% |
| Contains more Vitamin B3Vitamin B3 | +229.2% |
| Contains more Vitamin B5Vitamin B5 | +206656.8% |
| Contains more Vitamin B6Vitamin B6 | +285.7% |
| Contains more FolateFolate | +90.9% |
All nutrients comparison - raw data values
| Nutrient |  |
 |
DV% diff. |
| Vitamin B5 | 0.074mg | 153mg | 3059% |
| Vitamin K | 47.9µg | 25.9µg | 18% |
| Vitamin B1 | 0.074mg | 0.259mg | 15% |
| Copper | 0.057mg | 0.173mg | 13% |
| Phosphorus | 29mg | 117mg | 13% |
| Vitamin B6 | 0.056mg | 0.216mg | 12% |
| Iron | 0.65mg | 1.54mg | 11% |
| Manganese | 0.285mg | 0.525mg | 10% |
| Fiber | 3.2g | 5.5g | 9% |
| Zinc | 0.25mg | 1.19mg | 9% |
| Vitamin B3 | 0.614mg | 2.021mg | 9% |
| Folate | 33µg | 63µg | 8% |
| Protein | 1.89g | 5.36g | 7% |
| Vitamin C | 9.7mg | 14.2mg | 5% |
| Magnesium | 18mg | 39mg | 5% |
| Potassium | 146mg | 271mg | 4% |
| Vitamin B2 | 0.097mg | 0.149mg | 4% |
| Carbs | 7.88g | 15.63g | 3% |
| Selenium | 0.2µg | 1.9µg | 3% |
| Calories | 35kcal | 84kcal | 2% |
| Calcium | 44mg | 27mg | 2% |
| Vitamin E | 0.46mg | 0.14mg | 2% |
| Choline | 16.9mg | 29.7mg | 2% |
| Vitamin A | 32µg | 40µg | 1% |
| Fructose | 0.41g | 1% | |
| Protein per 100 calories | 5.4g | 6.4g | N/A |
| Calories per 10 g protein | 185kcal | 157kcal | N/A |
| Weight per 100 calories | 286g | 119g | N/A |
| Fats | 0.28g | 0.22g | 0% |
| Net carbs | 4.68g | 10.13g | N/A |
| Sugar | 3.63g | 5.93g | N/A |
| Sodium | 1mg | 3mg | 0% |
| Saturated fat | 0.064g | 0.039g | 0% |
| Monounsaturated fat | 0.011g | 0.019g | 0% |
| Polyunsaturated fat | 0.145g | 0.102g | 0% |
| Tryptophan | 0.02mg | 0.037mg | 0% |
| Threonine | 0.082mg | 0.201mg | 0% |
| Isoleucine | 0.069mg | 0.193mg | 0% |
| Leucine | 0.116mg | 0.32mg | 0% |
| Lysine | 0.091mg | 0.314mg | 0% |
| Methionine | 0.023mg | 0.081mg | 0% |
| Phenylalanine | 0.069mg | 0.198mg | 0% |
| Valine | 0.093mg | 0.232mg | 0% |
| Histidine | 0.035mg | 0.105mg | 0% |
Macronutrient Comparison
Macronutrient breakdown side-by-side comparison
Protein:
1.89 g
Fats:
0.28 g
Carbs:
7.88 g
Water:
89.22 g
Other:
0.73 g
Protein:
5.36 g
Fats:
0.22 g
Carbs:
15.63 g
Water:
77.87 g
Other:
0.92 g
| Contains more FatsFats | +27.3% |
| Contains more WaterWater | +14.6% |
| Contains more ProteinProtein | +183.6% |
| Contains more CarbsCarbs | +98.4% |
| Contains more OtherOther | +26% |
Fat Type Comparison
Fat type breakdown side-by-side comparison
Saturated fat:
Sat. Fat
0.064 g
Monounsaturated fat:
Mono. Fat
0.011 g
Polyunsaturated fat:
Poly. Fat
0.145 g
Saturated fat:
Sat. Fat
0.039 g
Monounsaturated fat:
Mono. Fat
0.019 g
Polyunsaturated fat:
Poly. Fat
0.102 g
| Contains more Poly. FatPolyunsaturated fat | +42.2% |
| Contains less Sat. FatSaturated fat | -39.1% |
| Contains more Mono. FatMonounsaturated fat | +72.7% |