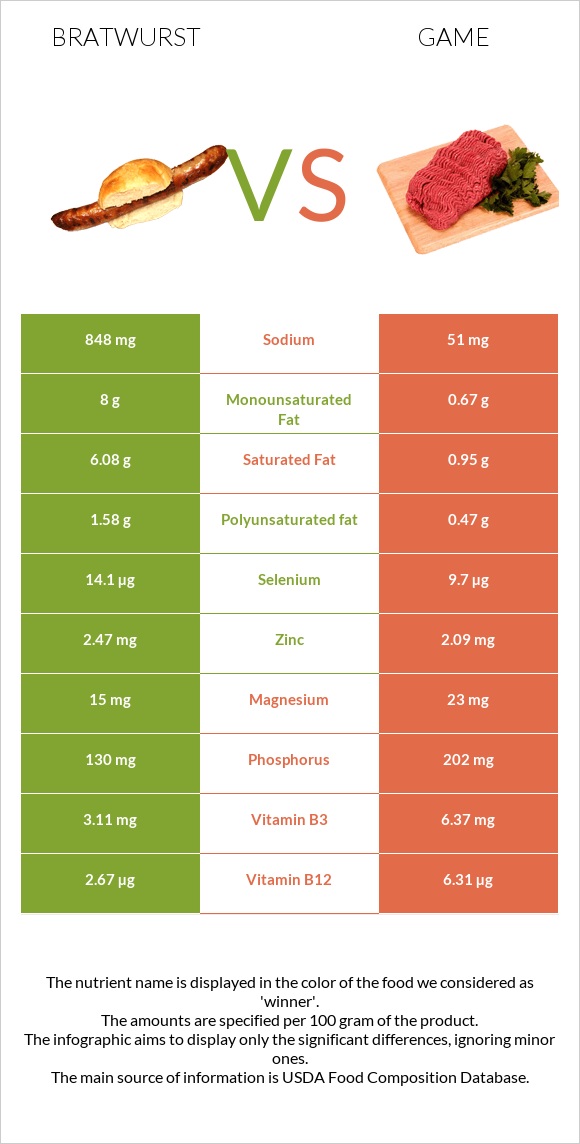
What are the differences between bratwurst and game? Bratwurst is higher in vitamin B1 and zinc, yet game is higher in iron, vitamin B2, copper, and phosphorus. Game's daily need coverage for iron is 40% more. Bratwurst has 16 times more sodium than game. While bratwurst has 848mg of sodium, game has only 54mg. The glycemic index of game is lower. We used Bratwurst, beef, and pork, smoked and Game meat, antelope, cooked, roasted types in this article.
Infographic
Mineral Comparison
Mineral comparison score is based on the number of minerals by which one or the other food is richer. The "coverage" charts below show how much of the daily needs can be covered by 300 grams of the food.
3
100 g
300 g
1 serving 2.33 oz - 66g
Magnesium
Magnesium
Calcium
Calcium
Potassium
Potassium
Iron
Iron
Copper
Copper
Zinc
Zinc
Phosphorus
Phosphorus
Sodium
Sodium
Manganese
Manganese
Selenium
Selenium
11%
2.1%
25%
38%
27%
67%
56%
111%
5.3%
77%
6
100 g
300 g
3 oz - 85g 1 piece, cooked (yield from 1 lb raw meat, boneless) - 340g
Magnesium
Magnesium
Calcium
Calcium
Potassium
Potassium
Iron
Iron
Copper
Copper
Zinc
Zinc
Phosphorus
Phosphorus
Sodium
Sodium
Manganese
Manganese
Selenium
Selenium
20%
1.2%
33%
158%
71%
46%
90%
7%
2.9%
70%
Vitamin Comparison
Vitamin comparison score is based on the number of vitamins by which one or the other food is richer. The "coverage" charts below show how much of the daily needs can be covered by 300 grams of the food.
5
100 g
300 g
1 serving 2.33 oz - 66g
Vitamin C
Vit. C
Vitamin D
Vit. D
Vitamin A
Vit. A
Vitamin E
Vit. E
Vitamin B1
Vit. B1
Vitamin B2
Vit. B2
Vitamin B3
Vit. B3
Vitamin B5
Vit. B5
Vitamin B6
Vit. B6
Vitamin B12
Vit. B12
Vitamin K
Vit. K
Folate
Folate
0%
0%
0%
0%
95%
49%
58%
41%
46%
334%
0%
3%
2
100 g
300 g
3 oz - 85g 1 piece, cooked (yield from 1 lb raw meat, boneless) - 340g
Vitamin C
Vit. C
Vitamin D
Vit. D
Vitamin A
Vit. A
Vitamin E
Vit. E
Vitamin B1
Vit. B1
Vitamin B2
Vit. B2
Vitamin B3
Vit. B3
Vitamin B5
Vit. B5
Vitamin B6
Vit. B6
Vitamin B12
Vit. B12
Vitamin K
Vit. K
Folate
Folate
0%
0%
0%
0%
65%
168%
0%
0%
0%
0%
0%
6.8%
All nutrients comparison - raw data values
Nutrient
DV% diff.
Vitamin B12
2.67µg
111%
Iron
1mg
4.2mg
40%
Vitamin B2
0.213mg
0.73mg
40%
Fats
26.34g
2.67g
36%
Protein
12.2g
29.45g
35%
Sodium
848mg
54mg
35%
Saturated fat
6.08g
0.97g
23%
Vitamin B3
3.11mg
19%
Monounsaturated fat
8g
0.63g
18%
Cholesterol
78mg
126mg
16%
Copper
0.08mg
0.213mg
15%
Vitamin B6
0.2mg
15%
Vitamin B5
0.69mg
14%
Phosphorus
130mg
210mg
11%
Vitamin B1
0.38mg
0.26mg
10%
Calories
297kcal
150kcal
7%
Zinc
2.47mg
1.68mg
7%
Polyunsaturated fat
1.58g
0.58g
7%
Magnesium
15mg
28mg
3%
Potassium
283mg
372mg
3%
Selenium
14.1µg
12.9µg
2%
Carbs
2g
0g
1%
Manganese
0.041mg
0.022mg
1%
Folate
4µg
9µg
1%
Protein per 100 calories
4.1g
20g
N/A
Calories per 10 g protein
243kcal
51kcal
N/A
Weight per 100 calories
34g
67g
N/A
Unsaturated / Saturated Fat ratio
1.6
1.2
N/A
Net carbs
2g
0g
N/A
Calcium
7mg
4mg
0%
Tryptophan
0.107mg
0%
Threonine
0.465mg
1.362mg
0%
Isoleucine
0.485mg
1.126mg
0%
Leucine
0.81mg
2.489mg
0%
Lysine
0.903mg
2.462mg
0%
Methionine
0.364mg
0.838mg
0%
Phenylalanine
0.405mg
1.166mg
0%
Valine
0.464mg
1.31mg
0%
Histidine
0.395mg
1.401mg
0%
Macronutrient Comparison
Macronutrient breakdown side-by-side comparison
3
12%
26%
2%
57%
3%
Protein:
12.2 g
Fats:
26.34 g
Carbs:
2 g
Water:
56.65 g
Other:
2.81 g
2
29%
3%
66%
2%
Protein:
29.45 g
Fats:
2.67 g
Carbs:
0 g
Water:
65.9 g
Other:
1.98 g
Contains
more
Fats Fats
+886.5%
Contains
more
Carbs Carbs
+∞%
Contains
more
Other Other
+41.9%
Contains
more
Protein Protein
+141.4%
Contains
more
Water Water
+16.3%
Fat Type Comparison
Fat type breakdown side-by-side comparison
2
39%
51%
10%
Saturated fat:
Sat. Fat
6.08 g
Monounsaturated fat:
Mono. Fat
8 g
Polyunsaturated fat:
Poly. Fat
1.58 g
1
44%
29%
27%
Saturated fat:
Sat. Fat
0.97 g
Monounsaturated fat:
Mono. Fat
0.63 g
Polyunsaturated fat:
Poly. Fat
0.58 g
Contains
more
Mono. Fat Monounsaturated fat
+1169.8%
Contains
more
Poly. Fat Polyunsaturated fat
+172.4%
Contains
less
Sat. Fat Saturated fat
-84%