Brisket vs. Porterhouse steak — In-Depth Nutrition Comparison
Compare
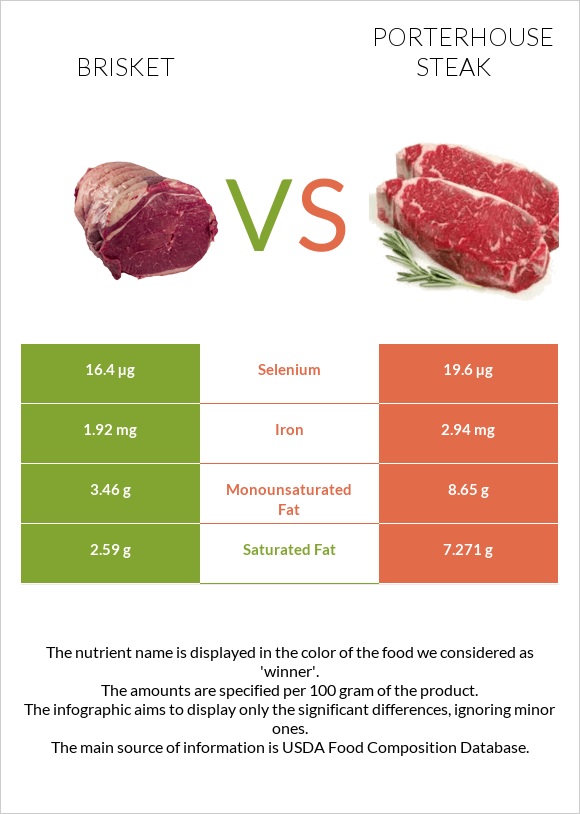
A recap on the differences between brisket and porterhouse steak
- Brisket is higher in zinc, selenium, and vitamin B5, yet porterhouse steak is higher in vitamin B6 and iron.
- Brisket covers your daily zinc needs 19% more than porterhouse steak.
- Brisket contains 2 times more vitamin B5 than porterhouse steak. While brisket contains 0.568mg of vitamin B5, porterhouse steak contains only 0.314mg.
- The amount of cholesterol in porterhouse steak is lower.
Food varieties used in this article are Beef, brisket, flat half, separable lean, and fat, trimmed to 1/8" fat, all grades, cooked, braised and Beef, short loin, porterhouse steak, separable lean, and fat, trimmed to 0" fat, all grades, cooked, broiled.
Infographic
Infographic link
Mineral Comparison
Mineral comparison score is based on the number of minerals by which one or the other food is richer. The "coverage" charts below show how much of the daily needs can be covered by 300 grams of the food.
| Contains more CalciumCalcium | +128.6% |
| Contains more ZincZinc | +46.7% |
| Contains less SodiumSodium | -26.2% |
| Contains more SeleniumSelenium | +38.3% |
| Contains more MagnesiumMagnesium | +15.8% |
| Contains more PotassiumPotassium | +28.9% |
| Contains more IronIron | +21% |
| Contains more CopperCopper | +30% |
| Contains more PhosphorusPhosphorus | +10.3% |
| Contains more ManganeseManganese | +50% |
Vitamin Comparison
Vitamin comparison score is based on the number of vitamins by which one or the other food is richer. The "coverage" charts below show how much of the daily needs can be covered by 300 grams of the food.
| Contains more Vitamin EVitamin E | +183.3% |
| Contains more Vitamin B5Vitamin B5 | +80.9% |
| Contains more Vitamin KVitamin K | +∞% |
| Contains more FolateFolate | +28.6% |
| Contains more Vitamin B1Vitamin B1 | +67.8% |
| Contains more Vitamin B2Vitamin B2 | +33.3% |
| Contains more Vitamin B6Vitamin B6 | +29.4% |
All nutrients comparison - raw data values
| Nutrient |  |
 |
DV% diff. |
| Zinc | 6.69mg | 4.56mg | 19% |
| Selenium | 27.1µg | 19.6µg | 14% |
| Cholesterol | 106mg | 67mg | 13% |
| Protein | 28.82g | 23.96g | 10% |
| Iron | 2.43mg | 2.94mg | 6% |
| Vitamin B6 | 0.282mg | 0.365mg | 6% |
| Vitamin B5 | 0.568mg | 0.314mg | 5% |
| Vitamin B2 | 0.171mg | 0.228mg | 4% |
| Copper | 0.1mg | 0.13mg | 3% |
| Phosphorus | 175mg | 193mg | 3% |
| Vitamin B1 | 0.059mg | 0.099mg | 3% |
| Vitamin B12 | 2.12µg | 2.18µg | 3% |
| Choline | 109.8mg | 91.3mg | 3% |
| Potassium | 232mg | 299mg | 2% |
| Vitamin E | 0.51mg | 0.18mg | 2% |
| Vitamin K | 1.8µg | 2% | |
| Monounsaturated fat | 7.934g | 8.65g | 2% |
| Calories | 289kcal | 276kcal | 1% |
| Fats | 18.42g | 19.27g | 1% |
| Magnesium | 19mg | 22mg | 1% |
| Calcium | 16mg | 7mg | 1% |
| Sodium | 48mg | 65mg | 1% |
| Vitamin B3 | 4.087mg | 4.21mg | 1% |
| Folate | 9µg | 7µg | 1% |
| Manganese | 0.01mg | 0.015mg | 0% |
| Saturated fat | 7.305g | 7.271g | 0% |
| Polyunsaturated fat | 0.681g | 0.69g | 0% |
| Tryptophan | 0.181mg | 0.259mg | 0% |
| Threonine | 1.101mg | 1.104mg | 0% |
| Isoleucine | 1.253mg | 1.228mg | 0% |
| Leucine | 2.192mg | 2.105mg | 0% |
| Lysine | 2.328mg | 2.233mg | 0% |
| Methionine | 0.717mg | 0.676mg | 0% |
| Phenylalanine | 1.088mg | 1.033mg | 0% |
| Valine | 1.367mg | 1.288mg | 0% |
| Histidine | 0.879mg | 0.775mg | 0% |
Macronutrient Comparison
Macronutrient breakdown side-by-side comparison
Protein:
28.82 g
Fats:
18.42 g
Carbs:
0 g
Water:
52.48 g
Other:
0.28 g
Protein:
23.96 g
Fats:
19.27 g
Carbs:
0 g
Water:
54.66 g
Other:
2.11 g
| Contains more ProteinProtein | +20.3% |
| Contains more OtherOther | +653.6% |
~equal in
Fats
~19.27g
~equal in
Carbs
~0g
~equal in
Water
~54.66g
Fat Type Comparison
Fat type breakdown side-by-side comparison
Saturated fat:
Sat. Fat
7.305 g
Monounsaturated fat:
Mono. Fat
7.934 g
Polyunsaturated fat:
Poly. Fat
0.681 g
Saturated fat:
Sat. Fat
7.271 g
Monounsaturated fat:
Mono. Fat
8.65 g
Polyunsaturated fat:
Poly. Fat
0.69 g
~equal in
Saturated fat
~7.271g
~equal in
Monounsaturated fat
~8.65g
~equal in
Polyunsaturated fat
~0.69g


