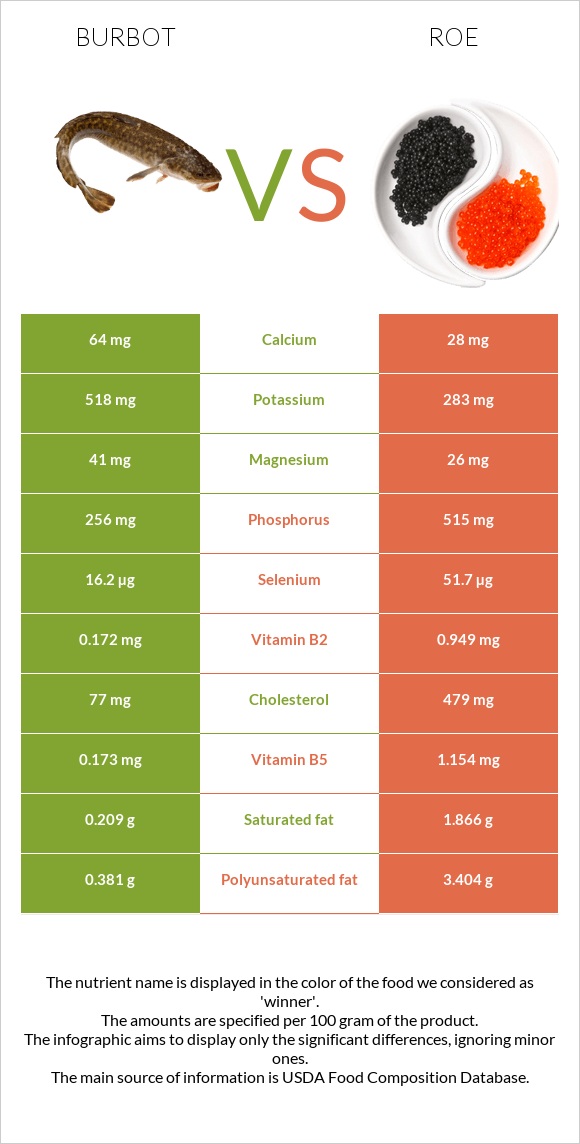
What are the differences between burbot and roe? Burbot is higher in manganese and copper, yet roe is higher in vitamin B12, selenium, vitamin B2, phosphorus, folate, vitamin B5, and vitamin C. Roe's daily need coverage for vitamin B12 is 442% more. Burbot has 69 times more manganese than roe. While burbot has 0.897mg of manganese, roe has only 0.013mg. The amount of cholesterol in burbot is lower. The glycemic index of burbot is lower. We used Fish, burbot, cooked, dry heat and Fish, roe, mixed species, cooked, dry heat types in this article.
Infographic
Mineral Comparison
Mineral comparison score is based on the number of minerals by which one or the other food is richer. The "coverage" charts below show how much of the daily needs can be covered by 300 grams of the food.
6
100 g
300 g
3 oz - 85g 1 fillet - 90g
Magnesium
Magnesium
Calcium
Calcium
Potassium
Potassium
Iron
Iron
Copper
Copper
Zinc
Zinc
Phosphorus
Phosphorus
Sodium
Sodium
Manganese
Manganese
Selenium
Selenium
29%
19%
46%
43%
85%
26%
110%
16%
117%
88%
3
100 g
300 g
1 oz - 28.35g 3 oz - 85g
Magnesium
Magnesium
Calcium
Calcium
Potassium
Potassium
Iron
Iron
Copper
Copper
Zinc
Zinc
Phosphorus
Phosphorus
Sodium
Sodium
Manganese
Manganese
Selenium
Selenium
19%
8.4%
25%
29%
43%
35%
221%
15%
1.7%
282%
Vitamin Comparison
Vitamin comparison score is based on the number of vitamins by which one or the other food is richer. The "coverage" charts below show how much of the daily needs can be covered by 300 grams of the food.
2
100 g
300 g
3 oz - 85g 1 fillet - 90g
Vitamin C
Vit. C
Vitamin D
Vit. D
Vitamin A
Vit. A
Vitamin E
Vit. E
Vitamin B1
Vit. B1
Vitamin B2
Vit. B2
Vitamin B3
Vit. B3
Vitamin B5
Vit. B5
Vitamin B6
Vit. B6
Vitamin B12
Vit. B12
Vitamin K
Vit. K
Folate
Folate
0%
0%
1.7%
0%
107%
40%
37%
10%
80%
115%
0%
0.75%
7
100 g
300 g
1 oz - 28.35g 3 oz - 85g
Vitamin C
Vit. C
Vitamin D
Vit. D
Vitamin A
Vit. A
Vitamin E
Vit. E
Vitamin B1
Vit. B1
Vitamin B2
Vit. B2
Vitamin B3
Vit. B3
Vitamin B5
Vit. B5
Vitamin B6
Vit. B6
Vitamin B12
Vit. B12
Vitamin K
Vit. K
Folate
Folate
55%
0%
30%
0%
69%
219%
41%
69%
43%
1443%
0%
69%
All nutrients comparison - raw data values
Nutrient
DV% diff.
Vitamin B12
0.92µg
11.54µg
443%
Cholesterol
77mg
479mg
134%
Selenium
16.2µg
51.7µg
65%
Vitamin B2
0.172mg
0.949mg
60%
Manganese
0.897mg
0.013mg
38%
Phosphorus
256mg
515mg
37%
Folate
1µg
92µg
23%
Vitamin B5
0.173mg
1.154mg
20%
Polyunsaturated fat
0.381g
3.404g
20%
Vitamin C
0mg
16.4mg
18%
Copper
0.256mg
0.128mg
14%
Vitamin B1
0.429mg
0.277mg
13%
Vitamin B6
0.346mg
0.185mg
12%
Fats
1.04g
8.23g
11%
Vitamin A
5µg
91µg
10%
Protein
24.76g
28.62g
8%
Saturated fat
0.209g
1.866g
8%
Potassium
518mg
283mg
7%
Iron
1.15mg
0.77mg
5%
Monounsaturated fat
0.17g
2.129g
5%
Calories
115kcal
204kcal
4%
Magnesium
41mg
26mg
4%
Calcium
64mg
28mg
4%
Zinc
0.97mg
1.28mg
3%
Carbs
0g
1.92g
1%
Vitamin B3
1.973mg
2.192mg
1%
Protein per 100 calories
22g
14g
N/A
Calories per 10 g protein
46kcal
71kcal
N/A
Weight per 100 calories
87g
49g
N/A
Unsaturated / Saturated Fat ratio
2.6
3
N/A
Net carbs
0g
1.92g
N/A
Sodium
124mg
117mg
0%
Tryptophan
0.277mg
0.375mg
0%
Threonine
1.085mg
1.305mg
0%
Isoleucine
1.141mg
1.465mg
0%
Leucine
2.012mg
2.509mg
0%
Lysine
2.274mg
2.179mg
0%
Methionine
0.733mg
0.71mg
0%
Phenylalanine
0.966mg
1.401mg
0%
Valine
1.275mg
1.676mg
0%
Histidine
0.729mg
0.778mg
0%
Omega-3 - EPA
0.09g
1.26g
N/A
Omega-3 - DHA
0.123g
1.747g
N/A
Omega-3 - DPA
0.033g
0.105g
N/A
Macronutrient Comparison
Macronutrient breakdown side-by-side comparison
1
25%
73%
Protein:
24.76 g
Fats:
1.04 g
Carbs:
0 g
Water:
73.41 g
Other:
0.79 g
4
29%
8%
2%
59%
3%
Protein:
28.62 g
Fats:
8.23 g
Carbs:
1.92 g
Water:
58.63 g
Other:
2.6 g
Contains
more
Water Water
+25.2%
Contains
more
Protein Protein
+15.6%
Contains
more
Fats Fats
+691.3%
Contains
more
Carbs Carbs
+∞%
Contains
more
Other Other
+229.1%
Fat Type Comparison
Fat type breakdown side-by-side comparison
1
28%
22%
50%
Saturated fat:
Sat. Fat
0.209 g
Monounsaturated fat:
Mono. Fat
0.17 g
Polyunsaturated fat:
Poly. Fat
0.381 g
2
25%
29%
46%
Saturated fat:
Sat. Fat
1.866 g
Monounsaturated fat:
Mono. Fat
2.129 g
Polyunsaturated fat:
Poly. Fat
3.404 g
Contains
less
Sat. Fat Saturated fat
-88.8%
Contains
more
Mono. Fat Monounsaturated fat
+1152.4%
Contains
more
Poly. Fat Polyunsaturated fat
+793.4%