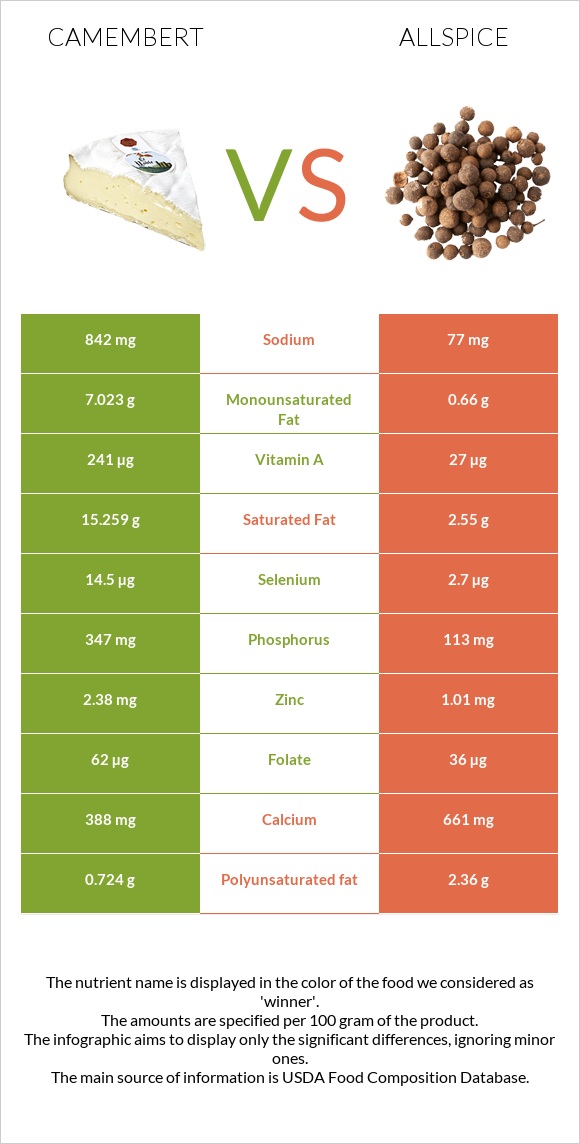
How are camembert and allspice different? Camembert is richer in vitamin B12, phosphorus, and vitamin B2, while allspice is higher in manganese, fiber, iron, copper, and vitamin C. Allspice covers your daily need for manganese, 126% more than camembert. Allspice is lower in sodium. Camembert has a higher glycemic index (27) than allspice (15). Cheese, camembert and Spices, allspice, ground types were used in this article.
Infographic
Mineral Comparison
Mineral comparison score is based on the number of minerals by which one or the other food is richer. The "coverage" charts below show how much of the daily needs can be covered by 300 grams of the food.
3
100 g
300 g
1 cubic inch - 17g 1 oz - 28.35g 1 wedge (1.33 oz) - 38g 1 cup - 246g
Magnesium
Magnesium
Calcium
Calcium
Potassium
Potassium
Iron
Iron
Copper
Copper
Zinc
Zinc
Phosphorus
Phosphorus
Sodium
Sodium
Manganese
Manganese
Selenium
Selenium
14%
116%
17%
12%
7%
65%
149%
110%
5%
79%
7
100 g
300 g
0.25 tsp - 0.5g 1 tsp - 1.9g 1 tbsp - 6g
Magnesium
Magnesium
Calcium
Calcium
Potassium
Potassium
Iron
Iron
Copper
Copper
Zinc
Zinc
Phosphorus
Phosphorus
Sodium
Sodium
Manganese
Manganese
Selenium
Selenium
96%
198%
92%
265%
184%
28%
48%
10%
384%
15%
Vitamin Comparison
Vitamin comparison score is based on the number of vitamins by which one or the other food is richer. The "coverage" charts below show how much of the daily needs can be covered by 300 grams of the food.
8
100 g
300 g
1 cubic inch - 17g 1 oz - 28.35g 1 wedge (1.33 oz) - 38g 1 cup - 246g
Vitamin C
Vit. C
Vitamin D
Vit. D
Vitamin A
Vit. A
Vitamin E
Vit. E
Vitamin B1
Vit. B1
Vitamin B2
Vit. B2
Vitamin B3
Vit. B3
Vitamin B5
Vit. B5
Vitamin B6
Vit. B6
Vitamin B12
Vit. B12
Vitamin K
Vit. K
Folate
Folate
0%
6%
80%
4.2%
7%
113%
12%
82%
52%
163%
5%
47%
3
100 g
300 g
0.25 tsp - 0.5g 1 tsp - 1.9g 1 tbsp - 6g
Vitamin C
Vit. C
Vitamin D
Vit. D
Vitamin A
Vit. A
Vitamin E
Vit. E
Vitamin B1
Vit. B1
Vitamin B2
Vit. B2
Vitamin B3
Vit. B3
Vitamin B5
Vit. B5
Vitamin B6
Vit. B6
Vitamin B12
Vit. B12
Vitamin K
Vit. K
Folate
Folate
131%
0%
9%
0%
25%
15%
54%
0%
48%
0%
0%
27%
All nutrients comparison - raw data values
Nutrient
DV% diff.
Manganese
0.038mg
2.943mg
126%
Fiber
0g
21.6g
86%
Iron
0.33mg
7.06mg
84%
Copper
0.021mg
0.553mg
59%
Saturated fat
15.259g
2.55g
58%
Vitamin B12
1.3µg
0µg
54%
Vitamin C
0mg
39.2mg
44%
Phosphorus
347mg
113mg
33%
Sodium
842mg
77mg
33%
Vitamin B2
0.488mg
0.063mg
33%
Protein
19.8g
6.09g
27%
Magnesium
20mg
135mg
27%
Calcium
388mg
661mg
27%
Vitamin B5
1.364mg
27%
Potassium
187mg
1044mg
25%
Fats
24.26g
8.69g
24%
Carbs
0.46g
72.12g
24%
Cholesterol
72mg
0mg
24%
Vitamin A
241µg
27µg
24%
Selenium
14.5µg
2.7µg
21%
Monounsaturated fat
7.023g
0.66g
16%
Vitamin B3
0.63mg
2.86mg
14%
Zinc
2.38mg
1.01mg
12%
Polyunsaturated fat
0.724g
2.36g
11%
Folate
62µg
36µg
7%
Vitamin B1
0.028mg
0.101mg
6%
Choline
15.4mg
3%
Calories
300kcal
263kcal
2%
Vitamin D*
18 IU
0 IU
2%
Vitamin D
0.4µg
0µg
2%
Vitamin K
2µg
2%
Vitamin E
0.21mg
1%
Vitamin B6
0.227mg
0.21mg
1%
Protein per 100 calories
6.6g
2.3g
N/A
Calories per 10 g protein
152kcal
432kcal
N/A
Weight per 100 calories
33g
38g
N/A
Unsaturated / Saturated Fat ratio
0.51
1.2
N/A
Net carbs
0.46g
50.52g
N/A
Sugar
0.46g
N/A
Tryptophan
0.307mg
0%
Threonine
0.717mg
0%
Isoleucine
0.968mg
0%
Leucine
1.84mg
0%
Lysine
1.766mg
0%
Methionine
0.565mg
0%
Phenylalanine
1.105mg
0%
Valine
1.279mg
0%
Histidine
0.683mg
0%
Macronutrient Comparison
Macronutrient breakdown side-by-side comparison
3
20%
24%
52%
4%
Protein:
19.8 g
Fats:
24.26 g
Carbs:
0.46 g
Water:
51.8 g
Other:
3.68 g
2
6%
9%
72%
8%
5%
Protein:
6.09 g
Fats:
8.69 g
Carbs:
72.12 g
Water:
8.46 g
Other:
4.64 g
Contains
more
Protein Protein
+225.1%
Contains
more
Fats Fats
+179.2%
Contains
more
Water Water
+512.3%
Contains
more
Carbs Carbs
+15578.3%
Contains
more
Other Other
+26.1%
Fat Type Comparison
Fat type breakdown side-by-side comparison
1
66%
31%
3%
Saturated fat:
Sat. Fat
15.259 g
Monounsaturated fat:
Mono. Fat
7.023 g
Polyunsaturated fat:
Poly. Fat
0.724 g
2
46%
12%
42%
Saturated fat:
Sat. Fat
2.55 g
Monounsaturated fat:
Mono. Fat
0.66 g
Polyunsaturated fat:
Poly. Fat
2.36 g
Contains
more
Mono. Fat Monounsaturated fat
+964.1%
Contains
less
Sat. Fat Saturated fat
-83.3%
Contains
more
Poly. Fat Polyunsaturated fat
+226%