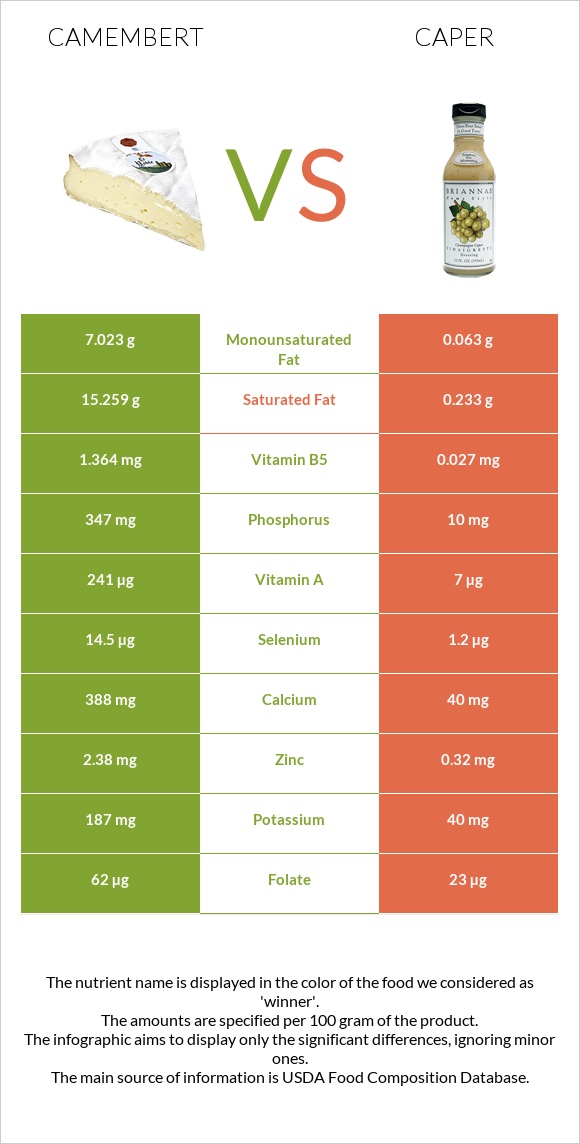
Differences between camembert and caper Camembert has more vitamin B12, phosphorus, calcium, vitamin B2, vitamin B5, and selenium, while caper has more copper. Camembert's daily need coverage for saturated fat is 75% higher. The amount of cholesterol in caper is lower. The food types used in this comparison are Cheese, camembert and Capers, canned .
Infographic
Mineral Comparison
Mineral comparison score is based on the number of minerals by which one or the other food is richer. The "coverage" charts below show how much of the daily needs can be covered by 300 grams of the food.
6
100 g
300 g
1 cubic inch - 17g 1 oz - 28.35g 1 wedge (1.33 oz) - 38g 1 cup - 246g
Magnesium
Magnesium
Calcium
Calcium
Potassium
Potassium
Iron
Iron
Copper
Copper
Zinc
Zinc
Phosphorus
Phosphorus
Sodium
Sodium
Manganese
Manganese
Selenium
Selenium
14%
116%
17%
12%
7%
65%
149%
110%
5%
79%
4
100 g
300 g
1 tbsp, drained - 8.6g
Magnesium
Magnesium
Calcium
Calcium
Potassium
Potassium
Iron
Iron
Copper
Copper
Zinc
Zinc
Phosphorus
Phosphorus
Sodium
Sodium
Manganese
Manganese
Selenium
Selenium
24%
12%
3.5%
63%
125%
8.7%
4.3%
306%
10%
6.5%
Vitamin Comparison
Vitamin comparison score is based on the number of vitamins by which one or the other food is richer. The "coverage" charts below show how much of the daily needs can be covered by 300 grams of the food.
8
100 g
300 g
1 cubic inch - 17g 1 oz - 28.35g 1 wedge (1.33 oz) - 38g 1 cup - 246g
Vitamin C
Vit. C
Vitamin D
Vit. D
Vitamin A
Vit. A
Vitamin E
Vit. E
Vitamin B1
Vit. B1
Vitamin B2
Vit. B2
Vitamin B3
Vit. B3
Vitamin B5
Vit. B5
Vitamin B6
Vit. B6
Vitamin B12
Vit. B12
Vitamin K
Vit. K
Folate
Folate
0%
6%
80%
4.2%
7%
113%
12%
82%
52%
163%
5%
47%
3
100 g
300 g
1 tbsp, drained - 8.6g
Vitamin C
Vit. C
Vitamin D
Vit. D
Vitamin A
Vit. A
Vitamin E
Vit. E
Vitamin B1
Vit. B1
Vitamin B2
Vit. B2
Vitamin B3
Vit. B3
Vitamin B5
Vit. B5
Vitamin B6
Vit. B6
Vitamin B12
Vit. B12
Vitamin K
Vit. K
Folate
Folate
14%
0%
2.3%
18%
4.5%
32%
12%
1.6%
5.3%
0%
62%
17%
All nutrients comparison - raw data values
Nutrient
DV% diff.
Saturated fat
15.259g
0.233g
68%
Sodium
842mg
2348mg
65%
Vitamin B12
1.3µg
0µg
54%
Phosphorus
347mg
10mg
48%
Copper
0.021mg
0.374mg
39%
Fats
24.26g
0.86g
36%
Protein
19.8g
2.36g
35%
Calcium
388mg
40mg
35%
Vitamin B2
0.488mg
0.139mg
27%
Vitamin B5
1.364mg
0.027mg
27%
Vitamin A
241µg
7µg
26%
Cholesterol
72mg
0mg
24%
Selenium
14.5µg
1.2µg
24%
Zinc
2.38mg
0.32mg
19%
Vitamin K
2µg
24.6µg
19%
Iron
0.33mg
1.67mg
17%
Monounsaturated fat
7.023g
0.063g
17%
Vitamin B6
0.227mg
0.023mg
16%
Calories
300kcal
23kcal
14%
Fiber
0g
3.2g
13%
Folate
62µg
23µg
10%
Vitamin C
0mg
4.3mg
5%
Potassium
187mg
40mg
4%
Vitamin E
0.21mg
0.88mg
4%
Magnesium
20mg
33mg
3%
Polyunsaturated fat
0.724g
0.304g
3%
Vitamin D*
18 IU
0 IU
2%
Vitamin D
0.4µg
0µg
2%
Manganese
0.038mg
0.078mg
2%
Choline
15.4mg
6.5mg
2%
Carbs
0.46g
4.89g
1%
Vitamin B1
0.028mg
0.018mg
1%
Protein per 100 calories
6.6g
10g
N/A
Calories per 10 g protein
152kcal
97kcal
N/A
Weight per 100 calories
33g
435g
N/A
Unsaturated / Saturated Fat ratio
0.51
1.6
N/A
Net carbs
0.46g
1.69g
N/A
Sugar
0.46g
0.41g
N/A
Vitamin B3
0.63mg
0.652mg
0%
Tryptophan
0.307mg
0%
Threonine
0.717mg
0%
Isoleucine
0.968mg
0%
Leucine
1.84mg
0%
Lysine
1.766mg
0%
Methionine
0.565mg
0%
Phenylalanine
1.105mg
0%
Valine
1.279mg
0%
Histidine
0.683mg
0%
Omega-3 - DPA
0g
0.001g
N/A
Macronutrient Comparison
Macronutrient breakdown side-by-side comparison
2
20%
24%
52%
4%
Protein:
19.8 g
Fats:
24.26 g
Carbs:
0.46 g
Water:
51.8 g
Other:
3.68 g
3
2%
5%
84%
8%
Protein:
2.36 g
Fats:
0.86 g
Carbs:
4.89 g
Water:
83.85 g
Other:
8.04 g
Contains
more
Protein Protein
+739%
Contains
more
Fats Fats
+2720.9%
Contains
more
Carbs Carbs
+963%
Contains
more
Water Water
+61.9%
Contains
more
Other Other
+118.5%
Fat Type Comparison
Fat type breakdown side-by-side comparison
2
66%
31%
3%
Saturated fat:
Sat. Fat
15.259 g
Monounsaturated fat:
Mono. Fat
7.023 g
Polyunsaturated fat:
Poly. Fat
0.724 g
1
39%
11%
51%
Saturated fat:
Sat. Fat
0.233 g
Monounsaturated fat:
Mono. Fat
0.063 g
Polyunsaturated fat:
Poly. Fat
0.304 g
Contains
more
Mono. Fat Monounsaturated fat
+11047.6%
Contains
more
Poly. Fat Polyunsaturated fat
+138.2%
Contains
less
Sat. Fat Saturated fat
-98.5%