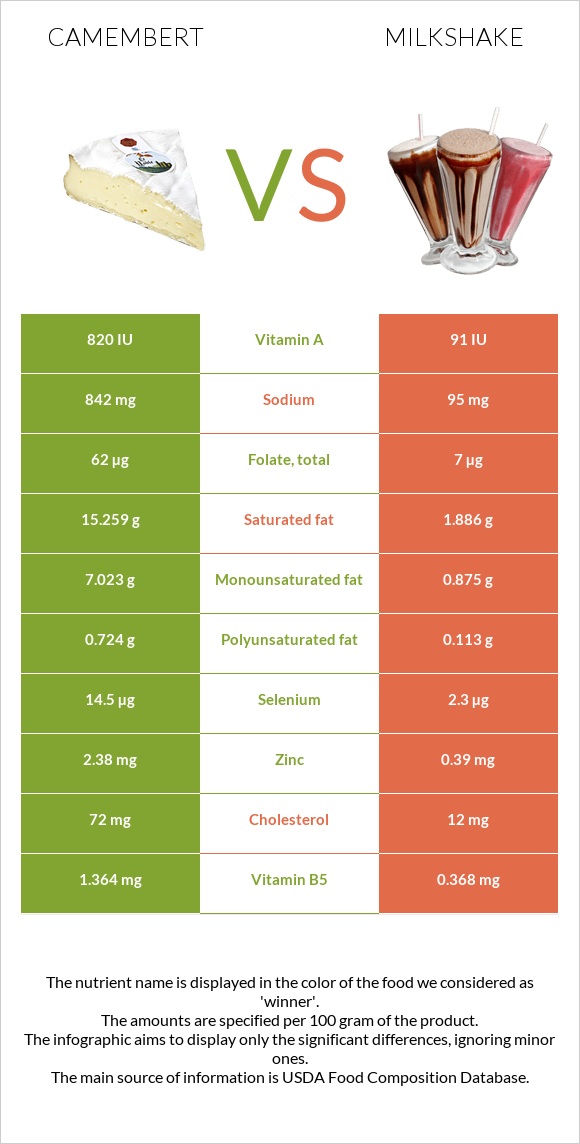
How are camembert and milkshake different? Camembert is higher than milkshake in phosphorus, vitamin B12, calcium, vitamin B2, selenium, vitamin B5, and zinc. Camembert covers your daily need for saturated fat, 67% more than milkshake. Camembert contains 9 times more sodium than milkshake. Camembert contains 842mg of sodium, while milkshake contains 95mg. Cheese, camembert and Milk shakes, thick vanilla types were used in this article.
Infographic
Mineral Comparison
Mineral comparison score is based on the number of minerals by which one or the other food is richer. The "coverage" charts below show how much of the daily needs can be covered by 300 grams of the food.
7
100 g
300 g
1 cubic inch - 17g 1 oz - 28.35g 1 wedge (1.33 oz) - 38g 1 cup - 246g
Magnesium
Magnesium
Calcium
Calcium
Potassium
Potassium
Iron
Iron
Copper
Copper
Zinc
Zinc
Phosphorus
Phosphorus
Sodium
Sodium
Manganese
Manganese
Selenium
Selenium
14%
116%
17%
12%
7%
65%
149%
110%
5%
79%
2
100 g
300 g
1 fl oz - 28.4g 1 container (11 oz) - 313g
Magnesium
Magnesium
Calcium
Calcium
Potassium
Potassium
Iron
Iron
Copper
Copper
Zinc
Zinc
Phosphorus
Phosphorus
Sodium
Sodium
Manganese
Manganese
Selenium
Selenium
8.6%
44%
16%
3.8%
17%
11%
49%
12%
1.8%
13%
Vitamin Comparison
Vitamin comparison score is based on the number of vitamins by which one or the other food is richer. The "coverage" charts below show how much of the daily needs can be covered by 300 grams of the food.
9
100 g
300 g
1 cubic inch - 17g 1 oz - 28.35g 1 wedge (1.33 oz) - 38g 1 cup - 246g
Vitamin C
Vit. C
Vitamin D
Vit. D
Vitamin A
Vit. A
Vitamin E
Vit. E
Vitamin B1
Vit. B1
Vitamin B2
Vit. B2
Vitamin B3
Vit. B3
Vitamin B5
Vit. B5
Vitamin B6
Vit. B6
Vitamin B12
Vit. B12
Vitamin K
Vit. K
Folate
Folate
0%
6%
80%
4.2%
7%
113%
12%
82%
52%
163%
5%
47%
1
100 g
300 g
1 fl oz - 28.4g 1 container (11 oz) - 313g
Vitamin C
Vit. C
Vitamin D
Vit. D
Vitamin A
Vit. A
Vitamin E
Vit. E
Vitamin B1
Vit. B1
Vitamin B2
Vit. B2
Vitamin B3
Vit. B3
Vitamin B5
Vit. B5
Vitamin B6
Vit. B6
Vitamin B12
Vit. B12
Vitamin K
Vit. K
Folate
Folate
0%
18%
8.3%
1%
7.5%
45%
2.7%
22%
9.7%
65%
0.5%
5.3%
All nutrients comparison - raw data values
Nutrient
DV% diff.
Saturated fat
15.259g
1.886g
61%
Fats
24.26g
3.03g
33%
Phosphorus
347mg
115mg
33%
Vitamin B12
1.3µg
0.52µg
33%
Protein
19.8g
3.86g
32%
Sodium
842mg
95mg
32%
Calcium
388mg
146mg
24%
Vitamin A
241µg
25µg
24%
Vitamin B2
0.488mg
0.195mg
23%
Selenium
14.5µg
2.3µg
22%
Cholesterol
72mg
12mg
20%
Vitamin B5
1.364mg
0.368mg
20%
Zinc
2.38mg
0.39mg
18%
Monounsaturated fat
7.023g
0.875g
15%
Vitamin B6
0.227mg
0.042mg
14%
Folate
62µg
7µg
14%
Calories
300kcal
112kcal
9%
Carbs
0.46g
17.75g
6%
Vitamin D*
18 IU
48 IU
4%
Vitamin D
0.4µg
1.2µg
4%
Polyunsaturated fat
0.724g
0.113g
4%
Iron
0.33mg
0.1mg
3%
Copper
0.021mg
0.051mg
3%
Vitamin B3
0.63mg
0.146mg
3%
Magnesium
20mg
12mg
2%
Vitamin K
2µg
0.2µg
2%
Vitamin E
0.21mg
0.05mg
1%
Manganese
0.038mg
0.014mg
1%
Protein per 100 calories
6.6g
3.4g
N/A
Calories per 10 g protein
152kcal
290kcal
N/A
Weight per 100 calories
33g
89g
N/A
Unsaturated / Saturated Fat ratio
0.51
0.52
N/A
Net carbs
0.46g
17.75g
N/A
Potassium
187mg
183mg
0%
Sugar
0.46g
17.75g
N/A
Vitamin B1
0.028mg
0.03mg
0%
Choline
15.4mg
14.3mg
0%
Tryptophan
0.307mg
0.054mg
0%
Threonine
0.717mg
0.174mg
0%
Isoleucine
0.968mg
0.234mg
0%
Leucine
1.84mg
0.378mg
0%
Lysine
1.766mg
0.306mg
0%
Methionine
0.565mg
0.097mg
0%
Phenylalanine
1.105mg
0.186mg
0%
Valine
1.279mg
0.258mg
0%
Histidine
0.683mg
0.105mg
0%
Macronutrient Comparison
Macronutrient breakdown side-by-side comparison
3
20%
24%
52%
4%
Protein:
19.8 g
Fats:
24.26 g
Carbs:
0.46 g
Water:
51.8 g
Other:
3.68 g
2
4%
3%
18%
74%
Protein:
3.86 g
Fats:
3.03 g
Carbs:
17.75 g
Water:
74.45 g
Other:
0.91 g
Contains
more
Protein Protein
+413%
Contains
more
Fats Fats
+700.7%
Contains
more
Other Other
+304.4%
Contains
more
Carbs Carbs
+3758.7%
Contains
more
Water Water
+43.7%
Fat Type Comparison
Fat type breakdown side-by-side comparison
2
66%
31%
3%
Saturated fat:
Sat. Fat
15.259 g
Monounsaturated fat:
Mono. Fat
7.023 g
Polyunsaturated fat:
Poly. Fat
0.724 g
1
66%
30%
4%
Saturated fat:
Sat. Fat
1.886 g
Monounsaturated fat:
Mono. Fat
0.875 g
Polyunsaturated fat:
Poly. Fat
0.113 g
Contains
more
Mono. Fat Monounsaturated fat
+702.6%
Contains
more
Poly. Fat Polyunsaturated fat
+540.7%
Contains
less
Sat. Fat Saturated fat
-87.6%