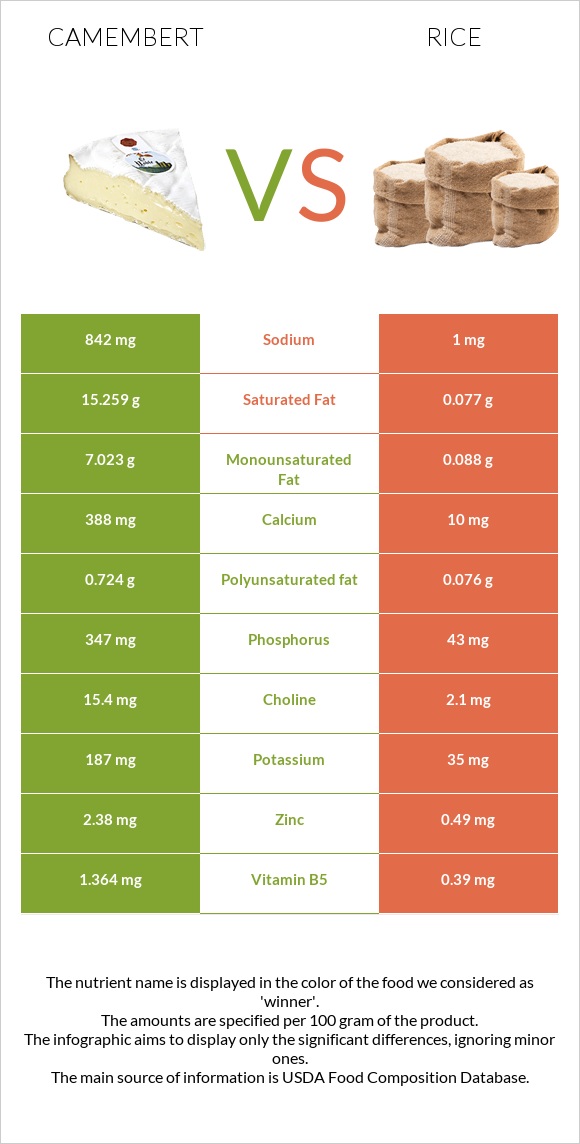
Important differences between camembert and rice Camembert has more vitamin B12, phosphorus, calcium, vitamin B2, vitamin B5, and zinc; however, rice has more manganese. Camembert's daily need coverage for saturated fat is 76% more. Rice is lower in cholesterol. Rice has a higher glycemic index than camembert. The food varieties used in the comparison are Cheese, camembert and Rice, white, long-grain, regular, enriched, cooked .
Infographic
Mineral Comparison
Mineral comparison score is based on the number of minerals by which one or the other food is richer. The "coverage" charts below show how much of the daily needs can be covered by 300 grams of the food.
6
100 g
300 g
1 cubic inch - 17g 1 oz - 28.35g 1 wedge (1.33 oz) - 38g 1 cup - 246g
Magnesium
Magnesium
Calcium
Calcium
Potassium
Potassium
Iron
Iron
Copper
Copper
Zinc
Zinc
Phosphorus
Phosphorus
Sodium
Sodium
Manganese
Manganese
Selenium
Selenium
14%
116%
17%
12%
7%
65%
149%
110%
5%
79%
4
100 g
300 g
1 cup - 158g
Magnesium
Magnesium
Calcium
Calcium
Potassium
Potassium
Iron
Iron
Copper
Copper
Zinc
Zinc
Phosphorus
Phosphorus
Sodium
Sodium
Manganese
Manganese
Selenium
Selenium
8.6%
3%
3.1%
45%
23%
13%
18%
0.13%
62%
41%
Vitamin Comparison
Vitamin comparison score is based on the number of vitamins by which one or the other food is richer. The "coverage" charts below show how much of the daily needs can be covered by 300 grams of the food.
8
100 g
300 g
1 cubic inch - 17g 1 oz - 28.35g 1 wedge (1.33 oz) - 38g 1 cup - 246g
Vitamin C
Vit. C
Vitamin D
Vit. D
Vitamin A
Vit. A
Vitamin E
Vit. E
Vitamin B1
Vit. B1
Vitamin B2
Vit. B2
Vitamin B3
Vit. B3
Vitamin B5
Vit. B5
Vitamin B6
Vit. B6
Vitamin B12
Vit. B12
Vitamin K
Vit. K
Folate
Folate
0%
6%
80%
4.2%
7%
113%
12%
82%
52%
163%
5%
47%
2
100 g
300 g
1 cup - 158g
Vitamin C
Vit. C
Vitamin D
Vit. D
Vitamin A
Vit. A
Vitamin E
Vit. E
Vitamin B1
Vit. B1
Vitamin B2
Vit. B2
Vitamin B3
Vit. B3
Vitamin B5
Vit. B5
Vitamin B6
Vit. B6
Vitamin B12
Vit. B12
Vitamin K
Vit. K
Folate
Folate
0%
0%
0%
0.8%
41%
3%
28%
23%
21%
0%
0%
44%
All nutrients comparison - raw data values
Nutrient
DV% diff.
Saturated fat
15.259g
0.077g
69%
Vitamin B12
1.3µg
0µg
54%
Phosphorus
347mg
43mg
43%
Calcium
388mg
10mg
38%
Fats
24.26g
0.28g
37%
Sodium
842mg
1mg
37%
Vitamin B2
0.488mg
0.013mg
37%
Protein
19.8g
2.69g
34%
Vitamin A
241µg
0µg
27%
Cholesterol
72mg
0mg
24%
Manganese
0.038mg
0.472mg
19%
Vitamin B5
1.364mg
0.39mg
19%
Zinc
2.38mg
0.49mg
17%
Monounsaturated fat
7.023g
0.088g
17%
Selenium
14.5µg
7.5µg
13%
Iron
0.33mg
1.2mg
11%
Vitamin B1
0.028mg
0.163mg
11%
Vitamin B6
0.227mg
0.093mg
10%
Calories
300kcal
130kcal
9%
Carbs
0.46g
28.17g
9%
Copper
0.021mg
0.069mg
5%
Vitamin B3
0.63mg
1.476mg
5%
Potassium
187mg
35mg
4%
Polyunsaturated fat
0.724g
0.076g
4%
Vitamin D*
18 IU
0 IU
2%
Vitamin D
0.4µg
0µg
2%
Magnesium
20mg
12mg
2%
Fiber
0g
0.4g
2%
Vitamin K
2µg
0µg
2%
Choline
15.4mg
2.1mg
2%
Vitamin E
0.21mg
0.04mg
1%
Folate
62µg
58µg
1%
Protein per 100 calories
6.6g
2.1g
N/A
Calories per 10 g protein
152kcal
483kcal
N/A
Weight per 100 calories
33g
77g
N/A
Unsaturated / Saturated Fat ratio
0.51
2.1
N/A
Net carbs
0.46g
27.77g
N/A
Sugar
0.46g
0.05g
N/A
Tryptophan
0.307mg
0.031mg
0%
Threonine
0.717mg
0.096mg
0%
Isoleucine
0.968mg
0.116mg
0%
Leucine
1.84mg
0.222mg
0%
Lysine
1.766mg
0.097mg
0%
Methionine
0.565mg
0.063mg
0%
Phenylalanine
1.105mg
0.144mg
0%
Valine
1.279mg
0.164mg
0%
Histidine
0.683mg
0.063mg
0%
Macronutrient Comparison
Macronutrient breakdown side-by-side comparison
3
20%
24%
52%
4%
Protein:
19.8 g
Fats:
24.26 g
Carbs:
0.46 g
Water:
51.8 g
Other:
3.68 g
2
3%
28%
68%
Protein:
2.69 g
Fats:
0.28 g
Carbs:
28.17 g
Water:
68.44 g
Other:
0.42 g
Contains
more
Protein Protein
+636.1%
Contains
more
Fats Fats
+8564.3%
Contains
more
Other Other
+776.2%
Contains
more
Carbs Carbs
+6023.9%
Contains
more
Water Water
+32.1%
Fat Type Comparison
Fat type breakdown side-by-side comparison
2
66%
31%
3%
Saturated fat:
Sat. Fat
15.259 g
Monounsaturated fat:
Mono. Fat
7.023 g
Polyunsaturated fat:
Poly. Fat
0.724 g
1
32%
37%
32%
Saturated fat:
Sat. Fat
0.077 g
Monounsaturated fat:
Mono. Fat
0.088 g
Polyunsaturated fat:
Poly. Fat
0.076 g
Contains
more
Mono. Fat Monounsaturated fat
+7880.7%
Contains
more
Poly. Fat Polyunsaturated fat
+852.6%
Contains
less
Sat. Fat Saturated fat
-99.5%