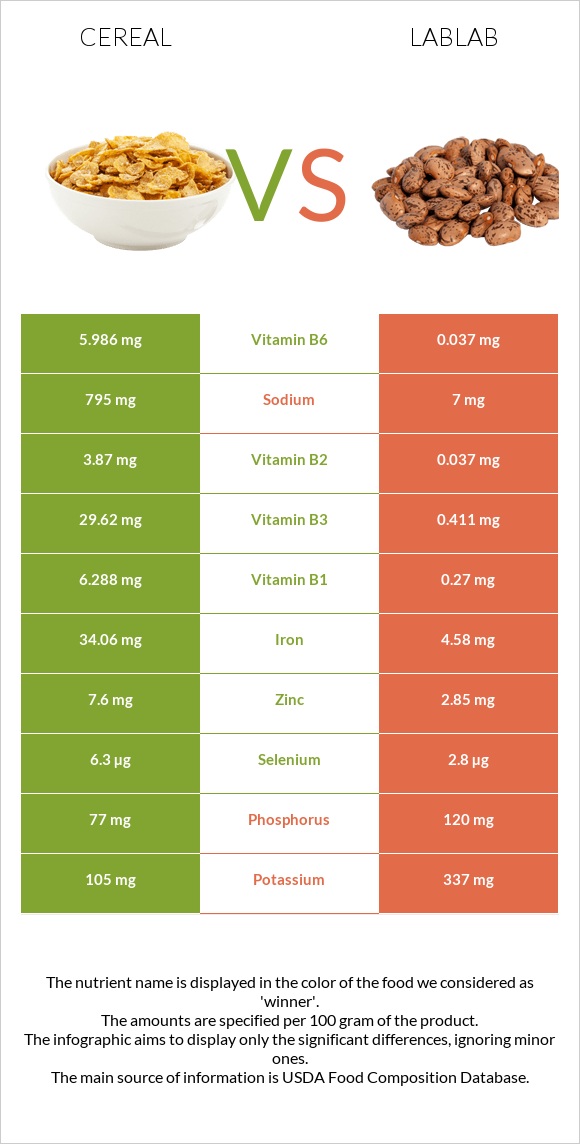
What are the main differences between cereal and lablab? Cereal is richer in vitamin B1, vitamin B6, iron, vitamin B2, vitamin B3, vitamin A, zinc, and vitamin C, while lablab is higher in copper. Cereal's daily need coverage for vitamin B1 is 502% higher. Lablab is lower in sodium. Cereal has a higher glycemic index (69) than lablab (45). We used Cereals ready-to-eat, USDA Commodity Corn and Rice (includes all commodity brands) and Hyacinth beans, mature seeds, cooked, boiled, without salt types in this comparison.
Infographic
Mineral Comparison
Mineral comparison score is based on the number of minerals by which one or the other food is richer. The "coverage" charts below show how much of the daily needs can be covered by 300 grams of the food.
4
100 g
300 g
1 cup - 29g 1 serving (NLEA serving = 1 cup) - 29g
Magnesium
Magnesium
Calcium
Calcium
Potassium
Potassium
Iron
Iron
Copper
Copper
Zinc
Zinc
Phosphorus
Phosphorus
Sodium
Sodium
Manganese
Manganese
Selenium
Selenium
14%
3%
9.3%
1277%
46%
207%
33%
104%
103%
34%
6
100 g
300 g
1 cup - 194g
Magnesium
Magnesium
Calcium
Calcium
Potassium
Potassium
Iron
Iron
Copper
Copper
Zinc
Zinc
Phosphorus
Phosphorus
Sodium
Sodium
Manganese
Manganese
Selenium
Selenium
59%
12%
30%
172%
114%
78%
51%
0.91%
63%
15%
Vitamin Comparison
Vitamin comparison score is based on the number of vitamins by which one or the other food is richer. The "coverage" charts below show how much of the daily needs can be covered by 300 grams of the food.
7
100 g
300 g
1 cup - 29g 1 serving (NLEA serving = 1 cup) - 29g
Vitamin C
Vit. C
Vitamin D
Vit. D
Vitamin A
Vit. A
Vitamin E
Vit. E
Vitamin B1
Vit. B1
Vitamin B2
Vit. B2
Vitamin B3
Vit. B3
Vitamin B5
Vit. B5
Vitamin B6
Vit. B6
Vitamin B12
Vit. B12
Vitamin K
Vit. K
Folate
Folate
128%
0%
271%
1.6%
1572%
893%
555%
14%
1381%
0%
0%
0%
2
100 g
300 g
1 cup - 194g
Vitamin C
Vit. C
Vitamin D
Vit. D
Vitamin A
Vit. A
Vitamin E
Vit. E
Vitamin B1
Vit. B1
Vitamin B2
Vit. B2
Vitamin B3
Vit. B3
Vitamin B5
Vit. B5
Vitamin B6
Vit. B6
Vitamin B12
Vit. B12
Vitamin K
Vit. K
Folate
Folate
0%
0%
0%
0%
68%
8.5%
7.7%
19%
8.5%
0%
0%
3%
All nutrients comparison - raw data values
Nutrient
DV% diff.
Vitamin B1
6.288mg
0.27mg
502%
Vitamin B6
5.986mg
0.037mg
458%
Iron
34.06mg
4.58mg
369%
Vitamin B2
3.87mg
0.037mg
295%
Vitamin B3
29.62mg
0.411mg
183%
Vitamin A
814µg
0µg
90%
Vitamin C
38.5mg
0mg
43%
Zinc
7.6mg
2.85mg
43%
Sodium
795mg
7mg
34%
Copper
0.137mg
0.341mg
23%
Carbs
86.85g
20.69g
22%
Magnesium
19mg
82mg
15%
Calories
378kcal
117kcal
13%
Manganese
0.79mg
0.482mg
13%
Potassium
105mg
337mg
7%
Fiber
1.4g
6%
Phosphorus
77mg
120mg
6%
Selenium
6.3µg
2.8µg
6%
Protein
6.06g
8.14g
4%
Calcium
10mg
40mg
3%
Vitamin B5
0.226mg
0.316mg
2%
Fats
1.08g
0.58g
1%
Vitamin E
0.08mg
1%
Folate
4µg
1%
Saturated fat
0.26g
0.099g
1%
Polyunsaturated fat
0.354g
0.245g
1%
Protein per 100 calories
1.6g
7g
N/A
Calories per 10 g protein
624kcal
144kcal
N/A
Weight per 100 calories
26g
85g
N/A
Net carbs
85.45g
20.69g
N/A
Sugar
10.35g
N/A
Monounsaturated fat
0.204g
0.026g
0%
Tryptophan
0.066mg
0.068mg
0%
Threonine
0.241mg
0.315mg
0%
Isoleucine
0.26mg
0.39mg
0%
Leucine
0.767mg
0.691mg
0%
Lysine
0.113mg
0.556mg
0%
Methionine
0.13mg
0.065mg
0%
Phenylalanine
0.365mg
0.41mg
0%
Valine
0.344mg
0.422mg
0%
Histidine
0.162mg
0.233mg
0%
Fructose
0.26g
0%
Macronutrient Comparison
Macronutrient breakdown side-by-side comparison
3
6%
87%
4%
2%
Protein:
6.06 g
Fats:
1.08 g
Carbs:
86.85 g
Water:
3.78 g
Other:
2.23 g
2
8%
21%
69%
Protein:
8.14 g
Fats:
0.58 g
Carbs:
20.69 g
Water:
69.13 g
Other:
1.46 g
Contains
more
Fats Fats
+86.2%
Contains
more
Carbs Carbs
+319.8%
Contains
more
Other Other
+52.7%
Contains
more
Protein Protein
+34.3%
Contains
more
Water Water
+1728.8%
Fat Type Comparison
Fat type breakdown side-by-side comparison
2
32%
25%
43%
Saturated fat:
Sat. Fat
0.26 g
Monounsaturated fat:
Mono. Fat
0.204 g
Polyunsaturated fat:
Poly. Fat
0.354 g
1
27%
7%
66%
Saturated fat:
Sat. Fat
0.099 g
Monounsaturated fat:
Mono. Fat
0.026 g
Polyunsaturated fat:
Poly. Fat
0.245 g
Contains
more
Mono. Fat Monounsaturated fat
+684.6%
Contains
more
Poly. Fat Polyunsaturated fat
+44.5%
Contains
less
Sat. Fat Saturated fat
-61.9%