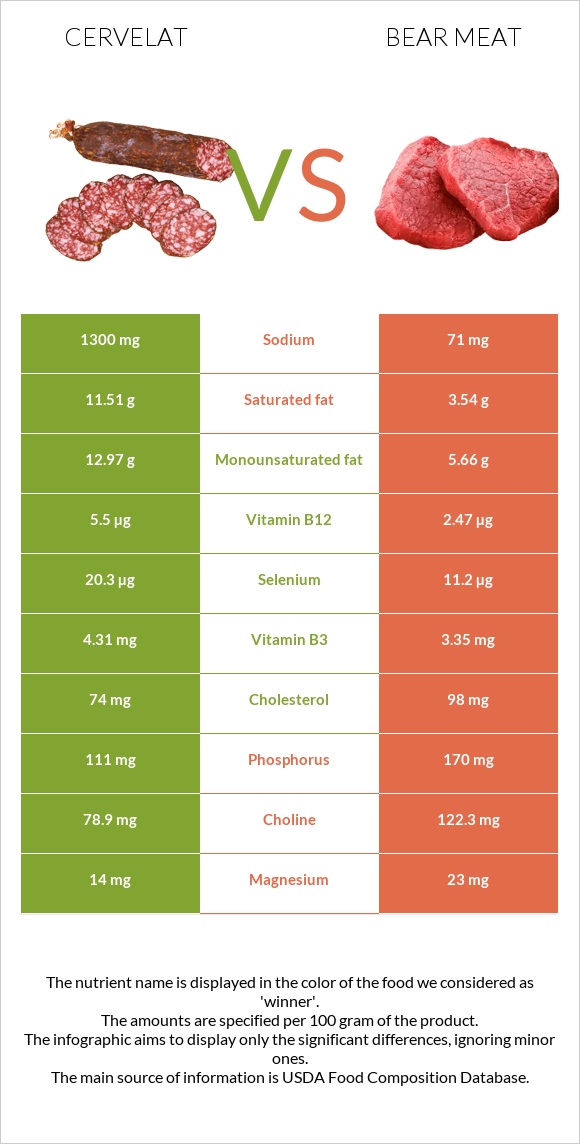
A recap on the differences between cervelat and bear meat Cervelat is higher in vitamin B12, vitamin C, and selenium, yet bear meat is higher in iron, zinc, vitamin B2, and phosphorus. Cervelat covers your daily vitamin B12 needs 126% more than bear meat. The amount of sodium in bear meat is lower. The glycemic index of bear meat is lower. Food varieties used in this article are Thuringer, cervelat, summer sausage, beef, pork and Game meat, bear, cooked, simmered .
Infographic
Mineral Comparison
Mineral comparison score is based on the number of minerals by which one or the other food is richer. The "coverage" charts below show how much of the daily needs can be covered by 300 grams of the food.
2
100 g
300 g
2 oz 1 serving - 56g
Magnesium
Magnesium
Calcium
Calcium
Potassium
Potassium
Iron
Iron
Copper
Copper
Zinc
Zinc
Phosphorus
Phosphorus
Sodium
Sodium
Manganese
Manganese
Selenium
Selenium
10%
2.7%
23%
77%
50%
70%
48%
170%
0%
111%
5
100 g
300 g
3 oz - 85g 1 piece, cooked (yield from 1 lb raw meat, boneless) - 277g
Magnesium
Magnesium
Calcium
Calcium
Potassium
Potassium
Iron
Iron
Copper
Copper
Zinc
Zinc
Phosphorus
Phosphorus
Sodium
Sodium
Manganese
Manganese
Selenium
Selenium
16%
1.5%
23%
402%
49%
280%
73%
9.3%
0%
61%
Vitamin Comparison
Vitamin comparison score is based on the number of vitamins by which one or the other food is richer. The "coverage" charts below show how much of the daily needs can be covered by 300 grams of the food.
5
100 g
300 g
2 oz 1 serving - 56g
Vitamin C
Vit. C
Vitamin D
Vit. D
Vitamin A
Vit. A
Vitamin E
Vit. E
Vitamin B1
Vit. B1
Vitamin B2
Vit. B2
Vitamin B3
Vit. B3
Vitamin B5
Vit. B5
Vitamin B6
Vit. B6
Vitamin B12
Vit. B12
Vitamin K
Vit. K
Folate
Folate
55%
17%
0%
4.4%
38%
76%
81%
0%
60%
688%
3.3%
1.5%
5
100 g
300 g
3 oz - 85g 1 piece, cooked (yield from 1 lb raw meat, boneless) - 277g
Vitamin C
Vit. C
Vitamin D
Vit. D
Vitamin A
Vit. A
Vitamin E
Vit. E
Vitamin B1
Vit. B1
Vitamin B2
Vit. B2
Vitamin B3
Vit. B3
Vitamin B5
Vit. B5
Vitamin B6
Vit. B6
Vitamin B12
Vit. B12
Vitamin K
Vit. K
Folate
Folate
0%
0%
0%
9.8%
25%
189%
63%
0%
67%
309%
4.5%
4.5%
All nutrients comparison - raw data values
Nutrient
DV% diff.
Vitamin B12
5.5µg
2.47µg
126%
Iron
2.04mg
10.73mg
109%
Zinc
2.56mg
10.27mg
70%
Sodium
1300mg
71mg
53%
Vitamin B2
0.33mg
0.82mg
38%
Saturated fat
11.51g
3.54g
36%
Protein
17.45g
32.42g
30%
Fats
30.43g
13.39g
26%
Vitamin C
16.6mg
0mg
18%
Monounsaturated fat
12.97g
5.66g
18%
Selenium
20.3µg
11.2µg
17%
Cholesterol
74mg
98mg
8%
Phosphorus
111mg
170mg
8%
Choline
78.9mg
122.3mg
8%
Polyunsaturated fat
1.2g
2.4g
8%
Vitamin D*
44 IU
0 IU
6%
Vitamin D
1.1µg
0µg
6%
Vitamin B3
4.31mg
3.35mg
6%
Calories
362kcal
259kcal
5%
Vitamin B1
0.15mg
0.1mg
4%
Magnesium
14mg
23mg
2%
Vitamin E
0.22mg
0.49mg
2%
Vitamin B6
0.26mg
0.29mg
2%
Carbs
3.33g
0g
1%
Folate
2µg
6µg
1%
Protein per 100 calories
4.8g
13g
N/A
Calories per 10 g protein
207kcal
80kcal
N/A
Weight per 100 calories
28g
39g
N/A
Unsaturated / Saturated Fat ratio
1.2
2.3
N/A
Net carbs
3.33g
0g
N/A
Calcium
9mg
5mg
0%
Potassium
260mg
263mg
0%
Sugar
0.85g
0g
N/A
Copper
0.15mg
0.148mg
0%
Vitamin K
1.3µg
1.8µg
0%
Omega-3 - DHA
0g
0.037g
N/A
Omega-3 - DPA
0g
0.034g
N/A
Macronutrient Comparison
Macronutrient breakdown side-by-side comparison
3
17%
30%
3%
45%
4%
Protein:
17.45 g
Fats:
30.43 g
Carbs:
3.33 g
Water:
45.18 g
Other:
3.61 g
2
32%
13%
54%
Protein:
32.42 g
Fats:
13.39 g
Carbs:
0 g
Water:
53.55 g
Other:
0.64 g
Contains
more
Fats Fats
+127.3%
Contains
more
Carbs Carbs
+∞%
Contains
more
Other Other
+464.1%
Contains
more
Protein Protein
+85.8%
Contains
more
Water Water
+18.5%
Fat Type Comparison
Fat type breakdown side-by-side comparison
1
45%
51%
5%
Saturated fat:
Sat. Fat
11.51 g
Monounsaturated fat:
Mono. Fat
12.97 g
Polyunsaturated fat:
Poly. Fat
1.2 g
2
31%
49%
21%
Saturated fat:
Sat. Fat
3.54 g
Monounsaturated fat:
Mono. Fat
5.66 g
Polyunsaturated fat:
Poly. Fat
2.4 g
Contains
more
Mono. Fat Monounsaturated fat
+129.2%
Contains
less
Sat. Fat Saturated fat
-69.2%
Contains
more
Poly. Fat Polyunsaturated fat
+100%