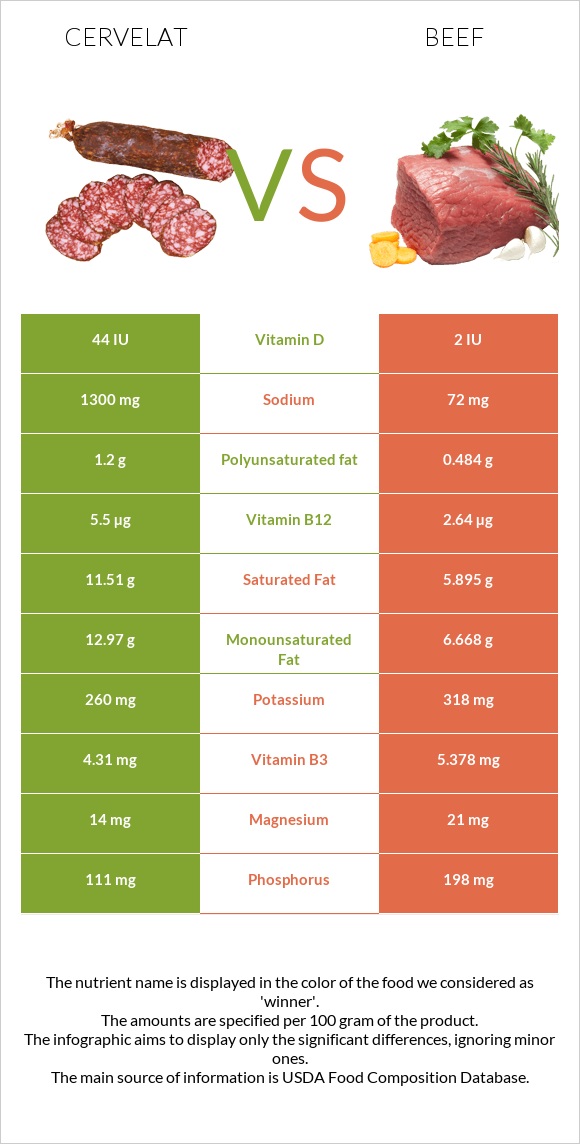
A recap on the differences between cervelat and beef Cervelat is higher in vitamin B12 and vitamin C, yet beef is higher in vitamin B6, phosphorus, iron, zinc, selenium, and vitamin B3. Cervelat covers your daily sodium needs 54% more than beef. The amount of sodium in beef is lower. The glycemic index of beef is lower. Food varieties used in this article are Thuringer, cervelat, summer sausage, beef, pork and Beef, loin, tenderloin roast, separable lean only, boneless, trimmed to 0" fat, select, cooked, roasted .
Infographic
Mineral Comparison
Mineral comparison score is based on the number of minerals by which one or the other food is richer. The "coverage" charts below show how much of the daily needs can be covered by 300 grams of the food.
1
100 g
300 g
2 oz 1 serving - 56g
Magnesium
Magnesium
Calcium
Calcium
Potassium
Potassium
Iron
Iron
Copper
Copper
Zinc
Zinc
Phosphorus
Phosphorus
Sodium
Sodium
Manganese
Manganese
Selenium
Selenium
10%
2.7%
23%
77%
50%
70%
48%
170%
0%
111%
8
100 g
300 g
3 oz - 85g 1 roast - 487g
Magnesium
Magnesium
Calcium
Calcium
Potassium
Potassium
Iron
Iron
Copper
Copper
Zinc
Zinc
Phosphorus
Phosphorus
Sodium
Sodium
Manganese
Manganese
Selenium
Selenium
10%
3.9%
31%
114%
32%
101%
111%
7%
1.2%
139%
Vitamin Comparison
Vitamin comparison score is based on the number of vitamins by which one or the other food is richer. The "coverage" charts below show how much of the daily needs can be covered by 300 grams of the food.
4
100 g
300 g
2 oz 1 serving - 56g
Vitamin C
Vit. C
Vitamin D
Vit. D
Vitamin A
Vit. A
Vitamin E
Vit. E
Vitamin B1
Vit. B1
Vitamin B2
Vit. B2
Vitamin B3
Vit. B3
Vitamin B5
Vit. B5
Vitamin B6
Vit. B6
Vitamin B12
Vit. B12
Vitamin K
Vit. K
Folate
Folate
55%
17%
0%
4.4%
38%
76%
81%
0%
60%
688%
3.3%
1.5%
8
100 g
300 g
3 oz - 85g 1 roast - 487g
Vitamin C
Vit. C
Vitamin D
Vit. D
Vitamin A
Vit. A
Vitamin E
Vit. E
Vitamin B1
Vit. B1
Vitamin B2
Vit. B2
Vitamin B3
Vit. B3
Vitamin B5
Vit. B5
Vitamin B6
Vit. B6
Vitamin B12
Vit. B12
Vitamin K
Vit. K
Folate
Folate
0%
1.5%
0.67%
5%
19%
92%
108%
29%
154%
526%
4%
5.3%
All nutrients comparison - raw data values
Nutrient
DV% diff.
Sodium
1300mg
54mg
54%
Vitamin B12
5.5µg
4.21µg
54%
Saturated fat
11.51g
2.595g
41%
Fats
30.43g
6.54g
37%
Vitamin B6
0.26mg
0.669mg
31%
Monounsaturated fat
12.97g
2.734g
26%
Phosphorus
111mg
259mg
21%
Protein
17.45g
27.55g
20%
Vitamin C
16.6mg
0mg
18%
Iron
2.04mg
3.04mg
13%
Calories
362kcal
169kcal
10%
Zinc
2.56mg
3.7mg
10%
Vitamin B5
0.481mg
10%
Selenium
20.3µg
25.4µg
9%
Vitamin B3
4.31mg
5.76mg
9%
Copper
0.15mg
0.097mg
6%
Vitamin B1
0.15mg
0.074mg
6%
Vitamin D*
44 IU
3 IU
5%
Vitamin D
1.1µg
0.1µg
5%
Vitamin B2
0.33mg
0.4mg
5%
Cholesterol
74mg
85mg
4%
Polyunsaturated fat
1.2g
0.532g
4%
Potassium
260mg
352mg
3%
Carbs
3.33g
0g
1%
Folate
2µg
7µg
1%
Choline
78.9mg
75.6mg
1%
Protein per 100 calories
4.8g
16g
N/A
Calories per 10 g protein
207kcal
61kcal
N/A
Weight per 100 calories
28g
59g
N/A
Unsaturated / Saturated Fat ratio
1.2
1.3
N/A
Net carbs
3.33g
0g
N/A
Magnesium
14mg
14mg
0%
Calcium
9mg
13mg
0%
Sugar
0.85g
0g
N/A
Vitamin A
0µg
2µg
0%
Vitamin E
0.22mg
0.25mg
0%
Manganese
0.009mg
0%
Vitamin K
1.3µg
1.6µg
0%
Trans fat
0.375g
N/A
Tryptophan
0.359mg
0%
Threonine
1.534mg
0%
Isoleucine
1.52mg
0%
Leucine
2.833mg
0%
Lysine
3.178mg
0%
Methionine
0.871mg
0%
Phenylalanine
1.299mg
0%
Valine
1.603mg
0%
Histidine
1.244mg
0%
Omega-3 - EPA
0g
0.002g
N/A
Omega-3 - DHA
0g
0.002g
N/A
Omega-3 - ALA
0.013g
N/A
Omega-3 - DPA
0g
0.011g
N/A
Omega-6 - Dihomo-gamma-linoleic acid
0.017g
N/A
Omega-6 - Eicosadienoic acid
0.002g
N/A
Omega-6 - Linoleic acid
0.349g
N/A
Macronutrient Comparison
Macronutrient breakdown side-by-side comparison
3
17%
30%
3%
45%
4%
Protein:
17.45 g
Fats:
30.43 g
Carbs:
3.33 g
Water:
45.18 g
Other:
3.61 g
2
28%
7%
66%
Protein:
27.55 g
Fats:
6.54 g
Carbs:
0 g
Water:
65.71 g
Other:
0.2 g
Contains
more
Fats Fats
+365.3%
Contains
more
Carbs Carbs
+∞%
Contains
more
Other Other
+1705%
Contains
more
Protein Protein
+57.9%
Contains
more
Water Water
+45.4%
Fat Type Comparison
Fat type breakdown side-by-side comparison
2
45%
51%
5%
Saturated fat:
Sat. Fat
11.51 g
Monounsaturated fat:
Mono. Fat
12.97 g
Polyunsaturated fat:
Poly. Fat
1.2 g
1
44%
47%
9%
Saturated fat:
Sat. Fat
2.595 g
Monounsaturated fat:
Mono. Fat
2.734 g
Polyunsaturated fat:
Poly. Fat
0.532 g
Contains
more
Mono. Fat Monounsaturated fat
+374.4%
Contains
more
Poly. Fat Polyunsaturated fat
+125.6%
Contains
less
Sat. Fat Saturated fat
-77.5%