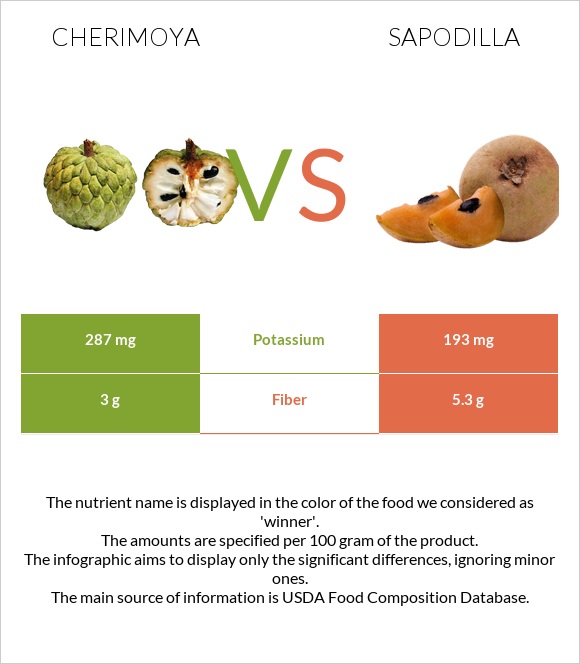
A recap on the differences between cherimoya and sapodillas Cherimoya has more vitamin B6, vitamin B2, and vitamin B1; however, sapodillas are higher in fiber and iron. Cherimoya covers your daily vitamin B6 needs 17% more than sapodillas. The glycemic index of cherimoya is higher. Food varieties used in this article are Cherimoya, raw and Sapodilla, raw .
Infographic
Mineral Comparison
Mineral comparison score is based on the number of minerals by which one or the other food is richer. The "coverage" charts below show how much of the daily needs can be covered by 300 grams of the food.
6
100 g
300 g
1 cup, pieces - 160g 1 fruit without skin and seeds - 235g
Magnesium
Magnesium
Calcium
Calcium
Potassium
Potassium
Iron
Iron
Copper
Copper
Zinc
Zinc
Phosphorus
Phosphorus
Sodium
Sodium
Manganese
Manganese
Selenium
Selenium
12%
3%
25%
10%
23%
4.4%
11%
0.91%
12%
0%
4
100 g
300 g
1 sapodilla - 170g 1 cup, pulp - 241g
Magnesium
Magnesium
Calcium
Calcium
Potassium
Potassium
Iron
Iron
Copper
Copper
Zinc
Zinc
Phosphorus
Phosphorus
Sodium
Sodium
Manganese
Manganese
Selenium
Selenium
8.6%
6.3%
17%
30%
29%
2.7%
5.1%
1.6%
0%
3.3%
Vitamin Comparison
Vitamin comparison score is based on the number of vitamins by which one or the other food is richer. The "coverage" charts below show how much of the daily needs can be covered by 300 grams of the food.
7
100 g
300 g
1 cup, pieces - 160g 1 fruit without skin and seeds - 235g
Vitamin C
Vit. C
Vitamin D
Vit. D
Vitamin A
Vit. A
Vitamin E
Vit. E
Vitamin B1
Vit. B1
Vitamin B2
Vit. B2
Vitamin B3
Vit. B3
Vitamin B5
Vit. B5
Vitamin B6
Vit. B6
Vitamin B12
Vit. B12
Vitamin K
Vit. K
Folate
Folate
42%
0%
0%
5.4%
25%
30%
12%
21%
59%
0%
0%
17%
2
100 g
300 g
1 sapodilla - 170g 1 cup, pulp - 241g
Vitamin C
Vit. C
Vitamin D
Vit. D
Vitamin A
Vit. A
Vitamin E
Vit. E
Vitamin B1
Vit. B1
Vitamin B2
Vit. B2
Vitamin B3
Vit. B3
Vitamin B5
Vit. B5
Vitamin B6
Vit. B6
Vitamin B12
Vit. B12
Vitamin K
Vit. K
Folate
Folate
49%
0%
1%
0%
0%
4.6%
3.8%
15%
8.5%
0%
0%
11%
All nutrients comparison - raw data values
Nutrient
DV% diff.
Vitamin B6
0.257mg
0.037mg
17%
Fiber
3g
5.3g
9%
Vitamin B2
0.131mg
0.02mg
9%
Vitamin B1
0.101mg
0mg
8%
Fructose
6.28g
8%
Iron
0.27mg
0.8mg
7%
Manganese
0.093mg
4%
Potassium
287mg
193mg
3%
Vitamin B3
0.644mg
0.2mg
3%
Protein
1.57g
0.44g
2%
Vitamin C
12.6mg
14.7mg
2%
Copper
0.069mg
0.086mg
2%
Phosphorus
26mg
12mg
2%
Vitamin E
0.27mg
2%
Vitamin B5
0.345mg
0.252mg
2%
Folate
23µg
14µg
2%
Fats
0.68g
1.1g
1%
Carbs
17.71g
19.96g
1%
Magnesium
17mg
12mg
1%
Calcium
10mg
21mg
1%
Zinc
0.16mg
0.1mg
1%
Selenium
0.6µg
1%
Monounsaturated fat
0.055g
0.521g
1%
Polyunsaturated fat
0.188g
0.011g
1%
Calories
75kcal
83kcal
0%
Protein per 100 calories
2.1g
0.53g
N/A
Calories per 10 g protein
478kcal
1886kcal
N/A
Weight per 100 calories
133g
120g
N/A
Net carbs
14.71g
14.66g
N/A
Sugar
12.87g
N/A
Sodium
7mg
12mg
0%
Vitamin A
0µg
3µg
0%
Saturated fat
0.233g
0.194g
0%
Tryptophan
0.031mg
0.005mg
0%
Threonine
0.052mg
0.012mg
0%
Isoleucine
0.042mg
0.015mg
0%
Leucine
0.063mg
0.024mg
0%
Lysine
0.042mg
0.039mg
0%
Methionine
0.021mg
0.003mg
0%
Phenylalanine
0.042mg
0.013mg
0%
Valine
0.063mg
0.016mg
0%
Histidine
0.021mg
0.016mg
0%
Omega-3 - ALA
0.159g
N/A
Omega-6 - Linoleic acid
0.028g
N/A
Macronutrient Comparison
Macronutrient breakdown side-by-side comparison
3
18%
79%
Protein:
1.57 g
Fats:
0.68 g
Carbs:
17.71 g
Water:
79.39 g
Other:
0.65 g
2
20%
78%
Protein:
0.44 g
Fats:
1.1 g
Carbs:
19.96 g
Water:
78 g
Other:
0.5 g
Contains
more
Protein Protein
+256.8%
Contains
more
Other Other
+30%
Contains
more
Fats Fats
+61.8%
Contains
more
Carbs Carbs
+12.7%
Fat Type Comparison
Fat type breakdown side-by-side comparison
1
49%
12%
39%
Saturated fat:
Sat. Fat
0.233 g
Monounsaturated fat:
Mono. Fat
0.055 g
Polyunsaturated fat:
Poly. Fat
0.188 g
2
27%
72%
Saturated fat:
Sat. Fat
0.194 g
Monounsaturated fat:
Mono. Fat
0.521 g
Polyunsaturated fat:
Poly. Fat
0.011 g
Contains
more
Poly. Fat Polyunsaturated fat
+1609.1%
Contains
less
Sat. Fat Saturated fat
-16.7%
Contains
more
Mono. Fat Monounsaturated fat
+847.3%