Important differences between cherries and tart Cherries have less vitamin B2, iron, vitamin B6, selenium, folate, vitamin B1, vitamin B3, phosphorus, and magnesium. Tart's daily need coverage for vitamin B2 is 39% more. Cherries are lower in sodium. Tart has a higher glycemic index than cherries. The food varieties used in the comparison are Cherries, sour, red, raw and Breakfast tart, low fat .
Infographic
Mineral Comparison
Mineral comparison score is based on the number of minerals by which one or the other food is richer. The "coverage" charts below show how much of the daily needs can be covered by 300 grams of the food.
4
100 g
300 g
1 cup, with pits, yields - 103g 1 cup, without pits - 155g
Magnesium
Magnesium
Calcium
Calcium
Potassium
Potassium
Iron
Iron
Copper
Copper
Zinc
Zinc
Phosphorus
Phosphorus
Sodium
Sodium
Manganese
Manganese
Selenium
Selenium
6.4%
4.8%
15%
12%
35%
2.7%
6.4%
0.39%
15%
0%
6
100 g
300 g
1 tart - 52g
Magnesium
Magnesium
Calcium
Calcium
Potassium
Potassium
Iron
Iron
Copper
Copper
Zinc
Zinc
Phosphorus
Phosphorus
Sodium
Sodium
Manganese
Manganese
Selenium
Selenium
31%
13%
5.8%
128%
24%
7.6%
40%
47%
0%
70%
Vitamin Comparison
Vitamin comparison score is based on the number of vitamins by which one or the other food is richer. The "coverage" charts below show how much of the daily needs can be covered by 300 grams of the food.
3
100 g
300 g
1 cup, with pits, yields - 103g 1 cup, without pits - 155g
Vitamin C
Vit. C
Vitamin D
Vit. D
Vitamin A
Vit. A
Vitamin E
Vit. E
Vitamin B1
Vit. B1
Vitamin B2
Vit. B2
Vitamin B3
Vit. B3
Vitamin B5
Vit. B5
Vitamin B6
Vit. B6
Vitamin B12
Vit. B12
Vitamin K
Vit. K
Folate
Folate
33%
0%
21%
1.4%
7.5%
9.2%
7.5%
8.6%
10%
0%
5.3%
6%
7
100 g
300 g
1 tart - 52g
Vitamin C
Vit. C
Vitamin D
Vit. D
Vitamin A
Vit. A
Vitamin E
Vit. E
Vitamin B1
Vit. B1
Vitamin B2
Vit. B2
Vitamin B3
Vit. B3
Vitamin B5
Vit. B5
Vitamin B6
Vit. B6
Vitamin B12
Vit. B12
Vitamin K
Vit. K
Folate
Folate
13%
0%
95%
11%
71%
127%
71%
0%
88%
0%
1%
75%
All nutrients comparison - raw data values
Nutrient
DV% diff.
Iron
0.32mg
3.42mg
39%
Vitamin B2
0.04mg
0.549mg
39%
Vitamin B6
0.044mg
0.38mg
26%
Vitamin A
64µg
285µg
25%
Selenium
0µg
12.9µg
23%
Folate
8µg
100µg
23%
Carbs
12.18g
76.8g
22%
Vitamin B1
0.03mg
0.285mg
21%
Vitamin B3
0.4mg
3.8mg
21%
Calories
50kcal
372kcal
16%
Sodium
3mg
361mg
16%
Phosphorus
15mg
93mg
11%
Fats
0.3g
5.99g
9%
Magnesium
9mg
44mg
8%
Monounsaturated fat
0.082g
3.338g
8%
Vitamin C
10mg
3.8mg
7%
Protein
1g
3.99g
6%
Saturated fat
0.068g
1.393g
6%
Manganese
0.112mg
5%
Polyunsaturated fat
0.09g
0.878g
5%
Fructose
3.51g
4%
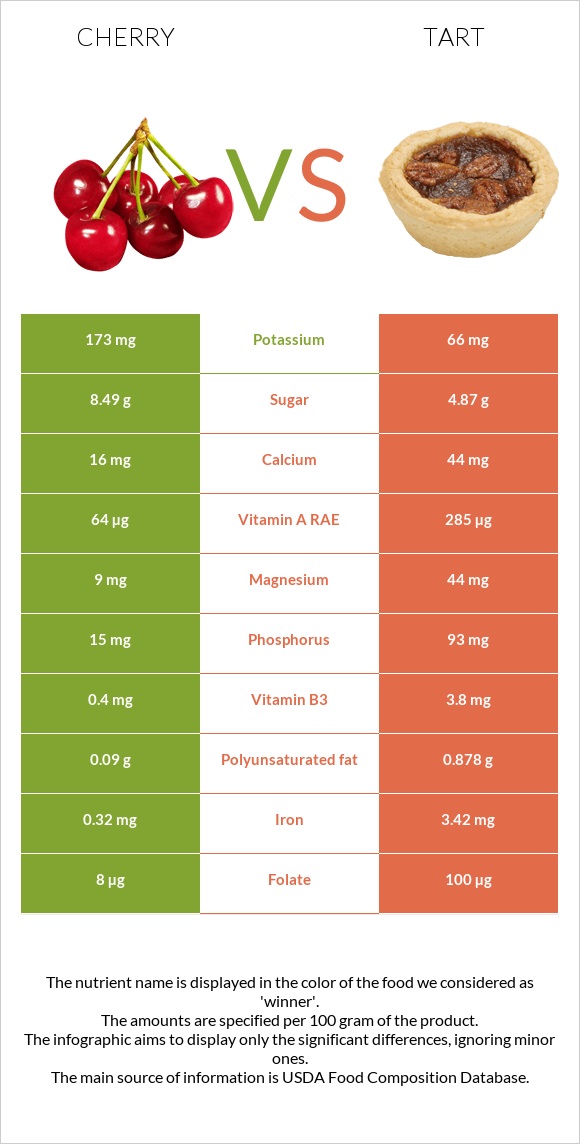
Calcium
16mg
44mg
3%
Potassium
173mg
66mg
3%
Copper
0.104mg
0.073mg
3%
Vitamin E
0.07mg
0.53mg
3%
Vitamin B5
0.143mg
3%
Zinc
0.1mg
0.28mg
2%
Vitamin K
2.1µg
0.4µg
1%
Protein per 100 calories
2g
1.1g
N/A
Calories per 10 g protein
500kcal
932kcal
N/A
Weight per 100 calories
200g
27g
N/A
Unsaturated / Saturated Fat ratio
2.5
3
N/A
Net carbs
10.58g
75.3g
N/A
Sugar
8.49g
4.87g
N/A
Fiber
1.6g
1.5g
0%
Choline
6.1mg
8.4mg
0%
Macronutrient Comparison
Macronutrient breakdown side-by-side comparison
1
12%
86%
Protein:
1 g
Fats:
0.3 g
Carbs:
12.18 g
Water:
86.13 g
Other:
0.39 g
4
4%
6%
77%
12%
Protein:
3.99 g
Fats:
5.99 g
Carbs:
76.8 g
Water:
12.04 g
Other:
1.18 g
Contains
more
Water Water
+615.4%
Contains
more
Protein Protein
+299%
Contains
more
Fats Fats
+1896.7%
Contains
more
Carbs Carbs
+530.5%
Contains
more
Other Other
+202.6%
Fat Type Comparison
Fat type breakdown side-by-side comparison
1
28%
34%
38%
Saturated fat:
Sat. Fat
0.068 g
Monounsaturated fat:
Mono. Fat
0.082 g
Polyunsaturated fat:
Poly. Fat
0.09 g
2
25%
60%
16%
Saturated fat:
Sat. Fat
1.393 g
Monounsaturated fat:
Mono. Fat
3.338 g
Polyunsaturated fat:
Poly. Fat
0.878 g
Contains
less
Sat. Fat Saturated fat
-95.1%
Contains
more
Mono. Fat Monounsaturated fat
+3970.7%
Contains
more
Poly. Fat Polyunsaturated fat
+875.6%