Chicken thigh vs. Pork spare ribs — In-Depth Nutrition Comparison
Compare
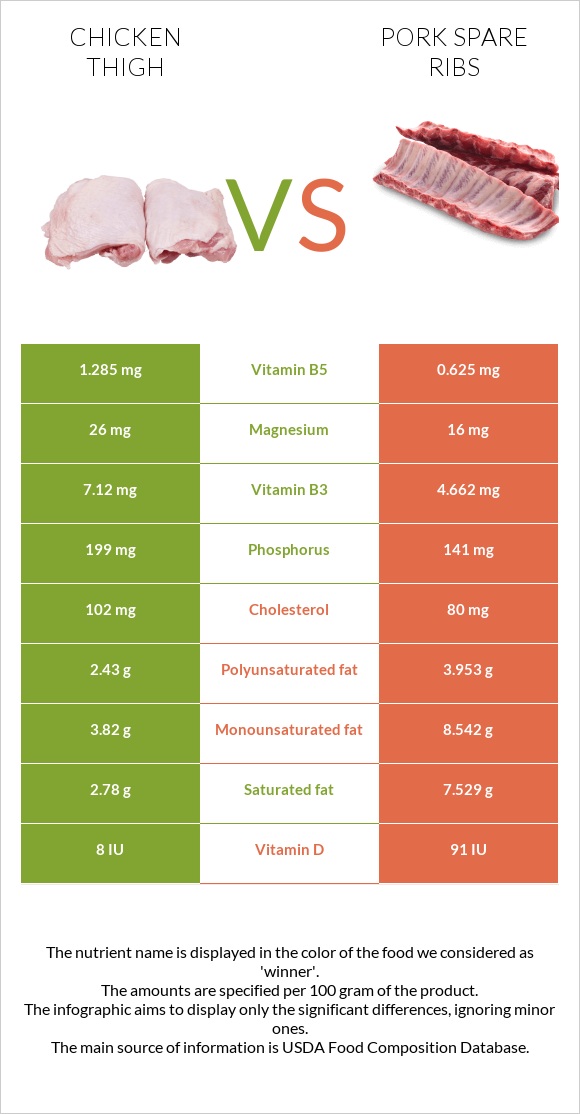
A recap on the differences between chicken thigh and pork spare ribs
- Chicken thigh is higher in vitamin B3, vitamin B5, phosphorus, and iron, yet pork spare ribs are higher in vitamin B1, vitamin B6, and vitamin D*.
- Pork spare ribs cover your daily saturated fat needs 24% more than chicken thigh.
- Chicken thigh contains 2 times more vitamin B5 than pork spare ribs. While chicken thigh contains 1.285mg of vitamin B5, pork spare ribs contain only 0.625mg.
- The amount of cholesterol in pork spare ribs is lower.
Food varieties used in this article are Chicken, broilers or fryers, thigh, meat only, cooked, fried and Pork, fresh, spareribs, separable lean, and fat, raw.
Infographic
Infographic link
Mineral Comparison
Mineral comparison score is based on the number of minerals by which one or the other food is richer. The "coverage" charts below show how much of the daily needs can be covered by 300 grams of the food.
| Contains more MagnesiumMagnesium | +62.5% |
| Contains more IronIron | +60.4% |
| Contains more CopperCopper | +12.5% |
| Contains more ZincZinc | +11.6% |
| Contains more PhosphorusPhosphorus | +41.1% |
| Contains more ManganeseManganese | +170% |
| Contains more CalciumCalcium | +15.4% |
| Contains less SodiumSodium | -14.7% |
Vitamin Comparison
Vitamin comparison score is based on the number of vitamins by which one or the other food is richer. The "coverage" charts below show how much of the daily needs can be covered by 300 grams of the food.
| Contains more Vitamin B3Vitamin B3 | +52.7% |
| Contains more Vitamin B5Vitamin B5 | +105.6% |
| Contains more FolateFolate | +∞% |
| Contains more Vitamin DVitamin D | +1050% |
| Contains more Vitamin B1Vitamin B1 | +262.5% |
| Contains more Vitamin B6Vitamin B6 | +51.1% |
| Contains more Vitamin B12Vitamin B12 | +15.2% |
All nutrients comparison - raw data values
| Nutrient |  |
 |
DV% diff. |
| Protein | 28.18g | 15.47g | 25% |
| Saturated fat | 2.78g | 7.529g | 22% |
| Fats | 10.3g | 23.4g | 20% |
| Vitamin B1 | 0.088mg | 0.319mg | 19% |
| Vitamin B3 | 7.12mg | 4.662mg | 15% |
| Vitamin B6 | 0.38mg | 0.574mg | 15% |
| Vitamin B5 | 1.285mg | 0.625mg | 13% |
| Monounsaturated fat | 3.82g | 8.542g | 12% |
| Vitamin D | 0.2µg | 2.3µg | 11% |
| Choline | 59.7mg | 11% | |
| Vitamin D* | 8 IU | 91 IU | 10% |
| Polyunsaturated fat | 2.43g | 3.953g | 10% |
| Phosphorus | 199mg | 141mg | 8% |
| Cholesterol | 102mg | 80mg | 7% |
| Iron | 1.46mg | 0.91mg | 7% |
| Calories | 218kcal | 277kcal | 3% |
| Zinc | 2.79mg | 2.5mg | 3% |
| Selenium | 20.5µg | 22µg | 3% |
| Magnesium | 26mg | 16mg | 2% |
| Vitamin E | 0.37mg | 2% | |
| Vitamin B12 | 0.33µg | 0.38µg | 2% |
| Folate | 9µg | 0µg | 2% |
| Potassium | 259mg | 242mg | 1% |
| Copper | 0.09mg | 0.08mg | 1% |
| Sodium | 95mg | 81mg | 1% |
| Manganese | 0.027mg | 0.01mg | 1% |
| Protein per 100 calories | 13g | 5.6g | N/A |
| Calories per 10 g protein | 77kcal | 179kcal | N/A |
| Weight per 100 calories | 46g | 36g | N/A |
| Unsaturated / Saturated Fat ratio | 2.2 | 1.7 | N/A |
| Net carbs | 1.18g | 0g | N/A |
| Carbs | 1.18g | 0g | 0% |
| Calcium | 13mg | 15mg | 0% |
| Vitamin B2 | 0.255mg | 0.251mg | 0% |
| Trans fat | 0.222g | N/A | |
| Tryptophan | 0.329mg | 0.163mg | 0% |
| Threonine | 1.188mg | 0.695mg | 0% |
| Isoleucine | 1.486mg | 0.761mg | 0% |
| Leucine | 2.115mg | 1.318mg | 0% |
| Lysine | 2.384mg | 1.435mg | 0% |
| Methionine | 0.778mg | 0.426mg | 0% |
| Phenylalanine | 1.121mg | 0.65mg | 0% |
| Valine | 1.397mg | 0.809mg | 0% |
| Histidine | 0.874mg | 0.668mg | 0% |
| Omega-3 - EPA | 0.01g | 0g | N/A |
| Omega-3 - DHA | 0.05g | 0g | N/A |
| Omega-3 - ALA | 0.081g | N/A | |
| Omega-3 - DPA | 0.03g | 0g | N/A |
| Omega-6 - Eicosadienoic acid | 0.079g | N/A | |
| Omega-6 - Linoleic acid | 3.146g | N/A |
Macronutrient Comparison
Macronutrient breakdown side-by-side comparison
Protein:
28.18 g
Fats:
10.3 g
Carbs:
1.18 g
Water:
59.31 g
Other:
1.03 g
Protein:
15.47 g
Fats:
23.4 g
Carbs:
0 g
Water:
59.75 g
Other:
1.38 g
| Contains more ProteinProtein | +82.2% |
| Contains more CarbsCarbs | +∞% |
| Contains more FatsFats | +127.2% |
| Contains more OtherOther | +34% |
~equal in
Water
~59.75g
Fat Type Comparison
Fat type breakdown side-by-side comparison
Saturated fat:
Sat. Fat
2.78 g
Monounsaturated fat:
Mono. Fat
3.82 g
Polyunsaturated fat:
Poly. Fat
2.43 g
Saturated fat:
Sat. Fat
7.529 g
Monounsaturated fat:
Mono. Fat
8.542 g
Polyunsaturated fat:
Poly. Fat
3.953 g
| Contains less Sat. FatSaturated fat | -63.1% |
| Contains more Mono. FatMonounsaturated fat | +123.6% |
| Contains more Poly. FatPolyunsaturated fat | +62.7% |


