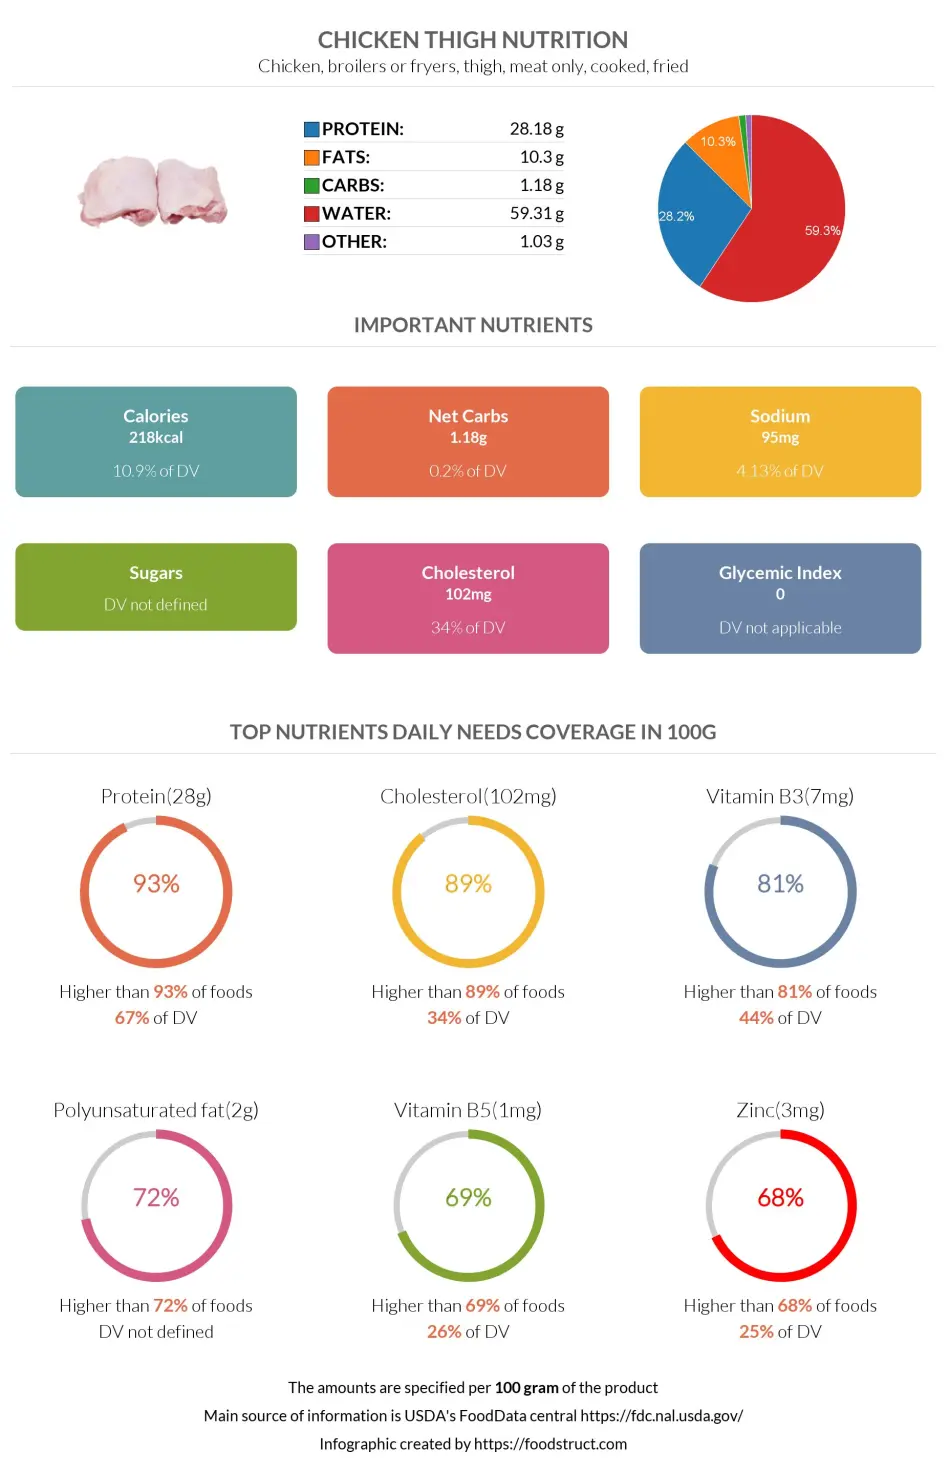
Chicken thigh nutrition: calories, carbs, GI, protein, fiber, fats
Chicken, broilers or fryers, thigh, meat only, cooked, fried
*all the values are displayed for the amount of 100 grams
Top nutrition facts for Chicken thigh
| Calories ⓘ Calories for selected serving | 218 kcal |
|
Glycemic index ⓘ
Source: *Explanation
0.25g of net carbs
Check out our Glycemic index chart page for the full list.
|
0 (low) |
| Glycemic load ⓘ Glycemic Load (GL) is a metric that measures both the quality (Glycemic Index) and quantity of carbohydrates in a specific serving of food to estimate its impact on blood sugar levels. It is calculated as: (GI × Carbs in grams) / 100. | 0 (low) |
| Net carbs ⓘ Net Carbs = Total Carbohydrates – Fiber – Sugar Alcohols | 1 g |
| Acidity (Based on PRAL) ⓘ PRAL (Potential renal acid load) is calculated using a formula. On the PRAL scale the higher the positive value, the more is the acidifying effect on the body. The lower the negative value, the higher the alkalinity of the food. 0 is neutral. | 14.9 (acidic) |
| Oxalates | 0.2 mg ⓘ https://www.hsph.harvard.edu/nutrition-questionnaire-service-center/nutrient-tables-download-page/ |
Omega-3 - DHA ⓘHigher in Omega-3 - DHA content than 95% of foods
Vitamin B5 ⓘHigher in Vitamin B5 content than 94% of foods
Cholesterol ⓘHigher in Cholesterol content than 93% of foods
Protein ⓘHigher in Protein content than 93% of foods
Omega-3 - EPA ⓘHigher in Omega-3 - EPA content than 92% of foods
Chicken thigh calories (kcal)
| Calories for different serving sizes of chicken thigh | Calories | Weight |
|---|---|---|
| Calories in 100 grams | 218 | |
| Calories in 1 thigh, bone and skin removed | 113 | 52 g |
| Calories for different varieties of chicken thigh | Calories | Weight |
|---|---|---|
| Chicken, broilers or fryers, thigh, meat only, cooked, fried (this food) | 218 | 100 g |
| Chicken thigh raw | 221 | 100 g |
Extra Nutrition facts for Chicken thigh
| Protein per 100 calories ⓘ Shows how many grams of protein you get from 100 calories of this food, calculated as (protein in g ÷ calories) × 100. | 13 g |
| Calories per 10 g protein ⓘ Shows how many calories you need to eat from this food to get 10 g of protein, calculated as (calories ÷ protein in g) × 10. | 77 kcal |
| Weight per 100 calories ⓘ Shows how many grams of this food equal 100 kcal—higher grams mean a larger portion for the same calories. | 46 g |
| Unsaturated / Saturated Fat ratio ⓘ (monounsaturated + polyunsaturated) / saturated, ≥2 broadly recommended by major guidelines for heart health | 2.2 |
| Creatine ⓘ Creatine is a naturally occurring compound in meat that helps fuel quick muscle energy. | 408 mg ⓘ https://www.sciencedirect.com/science/article/pii/S0032579119384482 |
| Carnosine ⓘ Carnosine is a dipeptide (made of two amino acids) that acts as an antioxidant and helps build muscles during exercise. | 86 mg ⓘ https://www.sciencedirect.com/science/article/pii/S0032579119384482 |
| Anserine ⓘ Anserine is a dipeptide (made of two amino acids) that acts as an antioxidant and helps build muscles during exercise. | 347 mg ⓘ https://www.sciencedirect.com/science/article/pii/S0032579119384482 |
| Inosine-5-phosphate ⓘ It is a naturally occurring nucleotide that contributes to the umami flavor of meats and plays a role in cell energy metabolism. | 154 mg ⓘ https://www.sciencedirect.com/science/article/pii/S0032579119384482 |
| Processing score ⓘ The processing score is a calculated value that looks at both how industrially made it is (NOVA) and how healthy/unprocessed the ingredients are (SIGA), then combines them into one score from 1 (least processed) to 4 (most processed). | 2 - Minimally processed ⓘ (Roasted, boiled) NOVA score = 2, SIGA score = A1 |
Chicken thigh Glycemic index (GI)
Mineral coverage chart
Mineral chart - relative view
Vitamin coverage chart
Vitamin A:
0µg of 900µg
0%
Vitamin E:
0mg of 15mg
0%
Vitamin D:
0.6µg of 20µg
3%
Vitamin C:
0mg of 90mg
0%
Vitamin B1:
0.26mg of 1mg
22%
Vitamin B2:
0.77mg of 1mg
59%
Vitamin B3:
21mg of 16mg
134%
Vitamin B5:
3.9mg of 5mg
77%
Vitamin B6:
1.1mg of 1mg
88%
Folate:
27µg of 400µg
6.8%
Vitamin B12:
0.99µg of 2µg
41%
Vitamin K:
0µg of 120µg
0%
Vitamin chart - relative view
Macronutrients chart
Protein:
Daily Value: 56%
28.2 g of 50 g
28.2 g (56% of DV )
Fats:
Daily Value: 16%
10.3 g of 65 g
10.3 g (16% of DV )
Carbs:
Daily Value: 0%
1.2 g of 300 g
1.2 g (0% of DV )
Water:
Daily Value: 3%
59.3 g of 2,000 g
59.3 g (3% of DV )
Other:
1 g
1 g
Protein quality breakdown
Tryptophan:
987mg of 280mg
353%
Threonine:
3564mg of 1,050mg
339%
Isoleucine:
4458mg of 1,400mg
318%
Leucine:
6345mg of 2,730mg
232%
Lysine:
7152mg of 2,100mg
341%
Methionine:
2334mg of 1,050mg
222%
Phenylalanine:
3363mg of 1,750mg
192%
Valine:
4191mg of 1,820mg
230%
Histidine:
2622mg of 700mg
375%
Fat type information
Saturated fat:
2.8 g
Monounsaturated fat:
3.8 g
Polyunsaturated fat:
2.4 g
All nutrients for Chicken thigh per 100g
| Nutrient | Value | DV% | In TOP % of foods | Comparison |
| Calories | 218kcal | 11% | 45% |
4.6 times more than Orange
|
| Weight per 100 calories | 46g | N/A | 56% | |
| Protein | 28g | 67% | 7% |
10 times more than Broccoli
|
| Protein per 100 calories | 13g | N/A | 19% | |
| Calories per 10 g protein | 77kcal | N/A | 78% | |
| Unsaturated / Saturated Fat ratio | 2.2 | N/A | 38% | |
| Fats | 10g | 16% | 34% |
3.2 times less than Cheese
|
| Vitamin C | 0mg | 0% | 100% |
N/A
|
| Carbs | 1.2g | 0% | 70% |
23.9 times less than Rice
|
| Net carbs | 1.2g | N/A | 69% |
45.9 times less than Chocolate
|
| Cholesterol | 102mg | 34% | 7% |
3.7 times less than Egg
|
| Vitamin D | 0.2µg | 1% | 16% |
11 times less than Egg
|
| Vitamin D* | 8 IU | 1% | 15% |
10.9 times less than Egg
|
| Magnesium | 26mg | 6% | 31% |
5.4 times less than Almonds
|
| Calcium | 13mg | 1% | 65% |
9.6 times less than Milk
|
| Potassium | 259mg | 8% | 42% |
1.8 times more than Cucumber
|
| Iron | 1.5mg | 18% | 48% |
1.8 times less than Beef broiled
|
| Fiber | 0g | 0% | 100% |
N/A
|
| Copper | 0.09mg | 10% | 44% |
1.6 times less than Shiitake
|
| Zinc | 2.8mg | 25% | 25% |
2.3 times less than Beef broiled
|
| Phosphorus | 199mg | 28% | 32% |
1.1 times more than Chicken meat
|
| Sodium | 95mg | 4% | 49% |
5.2 times less than White bread
|
| Manganese | 0.03mg | 1% | 48% | |
| Selenium | 21µg | 37% | 27% | |
| Vitamin B1 | 0.09mg | 7% | 46% |
3 times less than Pea raw
|
| Vitamin B2 | 0.26mg | 20% | 27% |
2 times more than Avocado
|
| Vitamin B3 | 7.1mg | 45% | 12% |
1.3 times less than Turkey meat
|
| Vitamin B5 | 1.3mg | 26% | 6% |
1.1 times more than Sunflower seeds
|
| Vitamin B6 | 0.38mg | 29% | 24% |
3.2 times more than Oats
|
| Vitamin B12 | 0.33µg | 14% | 41% |
2.1 times less than Pork
|
| Folate | 9µg | 2% | 51% |
6.8 times less than Brussels sprouts
|
| Saturated fat | 2.8g | 14% | 36% |
2.1 times less than Beef broiled
|
| Monounsaturated fat | 3.8g | N/A | 31% |
2.6 times less than Avocado
|
| Polyunsaturated fat | 2.4g | N/A | 21% |
19.4 times less than Walnut
|
| Tryptophan | 0.33mg | 0% | 5% |
1.1 times more than Chicken meat
|
| Threonine | 1.2mg | 0% | 8% |
1.7 times more than Beef broiled
|
| Isoleucine | 1.5mg | 0% | 3% |
1.6 times more than Salmon raw
|
| Leucine | 2.1mg | 0% | 10% |
1.1 times less than Tuna Bluefin
|
| Lysine | 2.4mg | 0% | 8% |
5.3 times more than Tofu
|
| Methionine | 0.78mg | 0% | 6% |
8.1 times more than Quinoa
|
| Phenylalanine | 1.1mg | 0% | 8% |
1.7 times more than Egg
|
| Valine | 1.4mg | 0% | 8% |
1.5 times less than Soybean raw
|
| Histidine | 0.87mg | 0% | 10% |
1.2 times more than Turkey meat
|
| Omega-3 - EPA | 0.01g | N/A | 8% |
69 times less than Salmon
|
| Omega-3 - DHA | 0.05g | N/A | 5% |
29.2 times less than Salmon
|
| Omega-3 - DPA | 0.03g | N/A | 4% |
5.7 times less than Salmon
|
Check out similar food or compare with current
NUTRITION FACTS LABEL
Nutrition Facts
___servings per container
Serving Size ______________
Serving Size ______________
Amount Per 100g
Calories 218
% Daily Value*
16%
Total Fat
10g
13%
Saturated Fat 2.8g
0
Trans Fat
0g
34%
Cholesterol 102mg
4.1%
Sodium 95mg
0.39%
Total Carbohydrate
1.2g
0
Dietary Fiber
0g
Total Sugars 0g
Includes ? g Added Sugars
Protein
28g
Vitamin D
8mcg
1%
Calcium
13mg
1.3%
Iron
1.5mg
18%
Potassium
259mg
7.6%
*
The % Daily Value (DV) tells you how much a nutrient in a serving of food contributes to a daily diet. 2,000 calories a day is used for general nutrition advice.
Health checks
ⓘ
Dietary cholesterol is not associated with an increased risk of coronary heart disease in healthy individuals. However, dietary cholesterol is common in foods that are high in harmful saturated fats.
Source
Low in Cholesterol
ⓘ
Trans fat consumption increases the risk of cardiovascular disease and mortality by negatively affecting blood lipid levels.
Source
No Trans Fats
ⓘ
Saturated fat intake can raise total cholesterol and LDL (low-density lipoprotein) levels, leading to an increased risk of atherosclerosis. Dietary guidelines recommend limiting saturated fats to under 10% of calories a day.
Source
Low in Saturated Fats
ⓘ
While the consumption of moderate amounts of added sugars is not detrimental to health, an excessive intake can increase the risk of obesity, and therefore, diabetes.
Source
Low in Sugars
Chicken thigh nutrition infographic
Infographic link
References
All the values for which the sources are not specified explicitly are taken from FDA’s Food Central. The exact link to the food presented on this page can be found below.