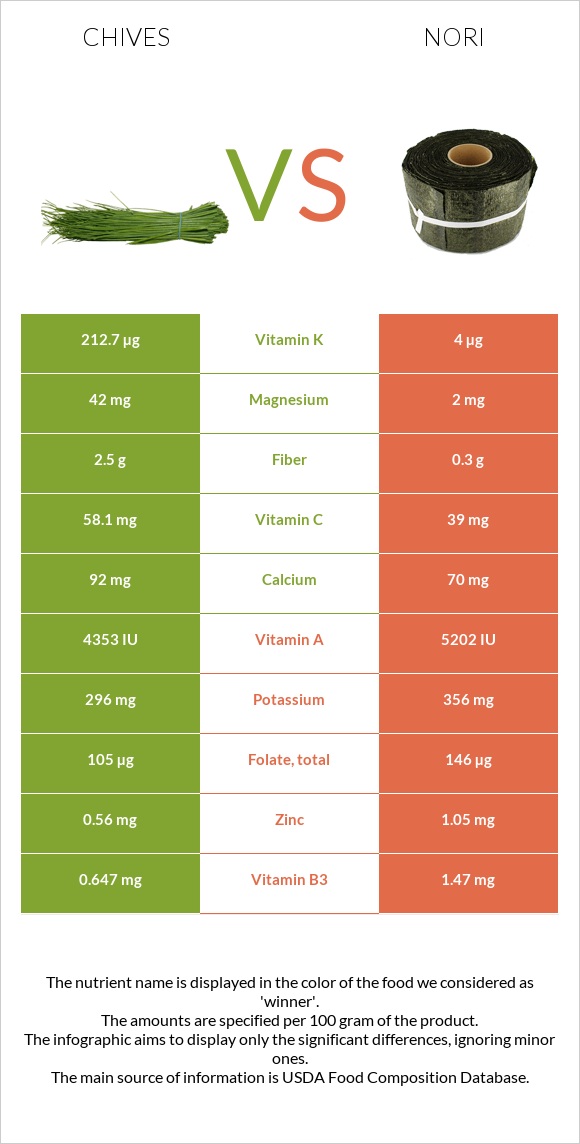
Important differences between chives and nori Chives have more vitamin K, vitamin C, magnesium, and fiber; however, nori has more manganese, vitamin B2, vitamin A, copper, folate, and vitamin E. Chives' daily need coverage for vitamin K is 174% more. Chives have 21 times more magnesium than nori. Chives have 42mg of magnesium, while nori has 2mg. The food varieties used in the comparison are Chives, raw and Seaweed, laver, raw .
Infographic
Mineral Comparison
Mineral comparison score is based on the number of minerals by which one or the other food is richer. The "coverage" charts below show how much of the daily needs can be covered by 300 grams of the food.
4
100 g
300 g
1 tsp chopped - 1g 1 tbsp chopped - 3g
Magnesium
Magnesium
Calcium
Calcium
Potassium
Potassium
Iron
Iron
Copper
Copper
Zinc
Zinc
Phosphorus
Phosphorus
Sodium
Sodium
Manganese
Manganese
Selenium
Selenium
30%
28%
26%
60%
52%
15%
25%
0.39%
49%
4.9%
5
100 g
300 g
2 tbsp (1/8 cup) - 10g 10 sheets - 26g
Magnesium
Magnesium
Calcium
Calcium
Potassium
Potassium
Iron
Iron
Copper
Copper
Zinc
Zinc
Phosphorus
Phosphorus
Sodium
Sodium
Manganese
Manganese
Selenium
Selenium
1.4%
21%
31%
68%
88%
29%
25%
6.3%
129%
3.8%
Vitamin Comparison
Vitamin comparison score is based on the number of vitamins by which one or the other food is richer. The "coverage" charts below show how much of the daily needs can be covered by 300 grams of the food.
2
100 g
300 g
1 tsp chopped - 1g 1 tbsp chopped - 3g
Vitamin C
Vit. C
Vitamin D
Vit. D
Vitamin A
Vit. A
Vitamin E
Vit. E
Vitamin B1
Vit. B1
Vitamin B2
Vit. B2
Vitamin B3
Vit. B3
Vitamin B5
Vit. B5
Vitamin B6
Vit. B6
Vitamin B12
Vit. B12
Vitamin K
Vit. K
Folate
Folate
194%
0%
73%
4.2%
20%
27%
12%
19%
32%
0%
532%
79%
8
100 g
300 g
2 tbsp (1/8 cup) - 10g 10 sheets - 26g
Vitamin C
Vit. C
Vitamin D
Vit. D
Vitamin A
Vit. A
Vitamin E
Vit. E
Vitamin B1
Vit. B1
Vitamin B2
Vit. B2
Vitamin B3
Vit. B3
Vitamin B5
Vit. B5
Vitamin B6
Vit. B6
Vitamin B12
Vit. B12
Vitamin K
Vit. K
Folate
Folate
130%
0%
87%
20%
25%
103%
28%
31%
37%
0%
10%
110%
All nutrients comparison - raw data values
Nutrient
DV% diff.
Vitamin K
212.7µg
4µg
174%
Manganese
0.373mg
0.988mg
27%
Vitamin B2
0.115mg
0.446mg
25%
Vitamin C
58.1mg
39mg
21%
Copper
0.157mg
0.264mg
12%
Magnesium
42mg
2mg
10%
Folate
105µg
146µg
10%
Fiber
2.5g
0.3g
9%
Protein
3.27g
5.81g
5%
Vitamin A
218µg
260µg
5%
Vitamin E
0.21mg
1mg
5%
Vitamin B3
0.647mg
1.47mg
5%
Zinc
0.56mg
1.05mg
4%
Vitamin B5
0.324mg
0.521mg
4%
Iron
1.6mg
1.8mg
3%
Calcium
92mg
70mg
2%
Potassium
296mg
356mg
2%
Sodium
3mg
48mg
2%
Vitamin B1
0.078mg
0.098mg
2%
Vitamin B6
0.138mg
0.159mg
2%
Fats
0.73g
0.28g
1%
Choline
5.2mg
10.4mg
1%
Polyunsaturated fat
0.267g
0.11g
1%
Calories
30kcal
35kcal
0%
Protein per 100 calories
11g
17g
N/A
Calories per 10 g protein
92kcal
60kcal
N/A
Weight per 100 calories
333g
286g
N/A
Net carbs
1.85g
4.81g
N/A
Carbs
4.35g
5.11g
0%
Sugar
1.85g
0.49g
N/A
Phosphorus
58mg
58mg
0%
Selenium
0.9µg
0.7µg
0%
Saturated fat
0.146g
0.061g
0%
Monounsaturated fat
0.095g
0.025g
0%
Tryptophan
0.037mg
0.043mg
0%
Threonine
0.128mg
0.232mg
0%
Isoleucine
0.139mg
0.259mg
0%
Leucine
0.195mg
0.501mg
0%
Lysine
0.163mg
0.222mg
0%
Methionine
0.036mg
0.145mg
0%
Phenylalanine
0.105mg
0.273mg
0%
Valine
0.145mg
0.402mg
0%
Histidine
0.057mg
0.14mg
0%
Omega-3 - EPA
0g
0.08g
N/A
Macronutrient Comparison
Macronutrient breakdown side-by-side comparison
2
3%
4%
91%
Protein:
3.27 g
Fats:
0.73 g
Carbs:
4.35 g
Water:
90.65 g
Other:
1 g
3
6%
5%
85%
4%
Protein:
5.81 g
Fats:
0.28 g
Carbs:
5.11 g
Water:
85.03 g
Other:
3.77 g
Contains
more
Fats Fats
+160.7%
Contains
more
Protein Protein
+77.7%
Contains
more
Carbs Carbs
+17.5%
Contains
more
Other Other
+277%
Fat Type Comparison
Fat type breakdown side-by-side comparison
2
29%
19%
53%
Saturated fat:
Sat. Fat
0.146 g
Monounsaturated fat:
Mono. Fat
0.095 g
Polyunsaturated fat:
Poly. Fat
0.267 g
1
31%
13%
56%
Saturated fat:
Sat. Fat
0.061 g
Monounsaturated fat:
Mono. Fat
0.025 g
Polyunsaturated fat:
Poly. Fat
0.11 g
Contains
more
Mono. Fat Monounsaturated fat
+280%
Contains
more
Poly. Fat Polyunsaturated fat
+142.7%
Contains
less
Sat. Fat Saturated fat
-58.2%