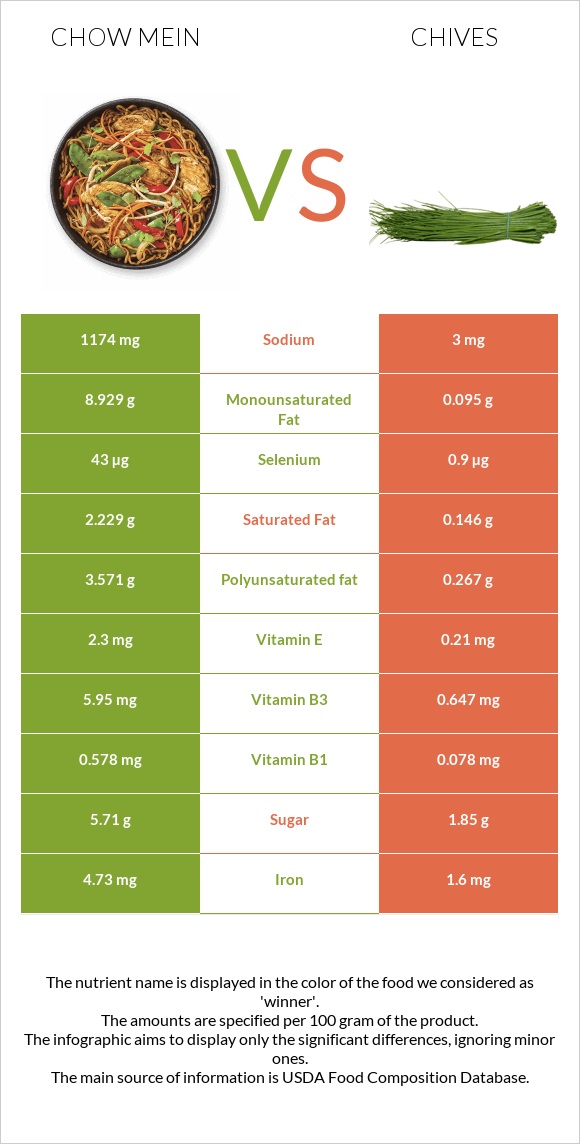
How are chow mein and chives different? Chow mein is higher in selenium, vitamin B1, iron, vitamin B3, vitamin B2, and phosphorus; however, chives are richer in vitamin K, vitamin A, and vitamin C. Daily need coverage for vitamin K for chives is 176% higher. Chow mein contains 391 times more sodium than chives. While chow mein contains 1174mg of sodium, chives contain only 3mg. Noodles, chinese, chow mein and Chives, raw are the varieties used in this article.
Infographic
Mineral Comparison
Mineral comparison score is based on the number of minerals by which one or the other food is richer. The "coverage" charts below show how much of the daily needs can be covered by 300 grams of the food.
5
100 g
300 g
0.5 cup dry - 28g 1.5 oz - 43g
Magnesium
Magnesium
Calcium
Calcium
Potassium
Potassium
Iron
Iron
Copper
Copper
Zinc
Zinc
Phosphorus
Phosphorus
Sodium
Sodium
Manganese
Manganese
Selenium
Selenium
37%
6%
11%
177%
56%
38%
69%
153%
0%
235%
4
100 g
300 g
1 tsp chopped - 1g 1 tbsp chopped - 3g
Magnesium
Magnesium
Calcium
Calcium
Potassium
Potassium
Iron
Iron
Copper
Copper
Zinc
Zinc
Phosphorus
Phosphorus
Sodium
Sodium
Manganese
Manganese
Selenium
Selenium
30%
28%
26%
60%
52%
15%
25%
0.39%
49%
4.9%
Vitamin Comparison
Vitamin comparison score is based on the number of vitamins by which one or the other food is richer. The "coverage" charts below show how much of the daily needs can be covered by 300 grams of the food.
5
100 g
300 g
0.5 cup dry - 28g 1.5 oz - 43g
Vitamin C
Vit. C
Vitamin D
Vit. D
Vitamin A
Vit. A
Vitamin E
Vit. E
Vitamin B1
Vit. B1
Vitamin B2
Vit. B2
Vitamin B3
Vit. B3
Vitamin B5
Vit. B5
Vitamin B6
Vit. B6
Vitamin B12
Vit. B12
Vitamin K
Vit. K
Folate
Folate
0%
0%
0%
46%
145%
97%
112%
32%
25%
0%
3.5%
80%
4
100 g
300 g
1 tsp chopped - 1g 1 tbsp chopped - 3g
Vitamin C
Vit. C
Vitamin D
Vit. D
Vitamin A
Vit. A
Vitamin E
Vit. E
Vitamin B1
Vit. B1
Vitamin B2
Vit. B2
Vitamin B3
Vit. B3
Vitamin B5
Vit. B5
Vitamin B6
Vit. B6
Vitamin B12
Vit. B12
Vitamin K
Vit. K
Folate
Folate
194%
0%
73%
4.2%
20%
27%
12%
19%
32%
0%
532%
79%
All nutrients comparison - raw data values
Nutrient
DV% diff.
Vitamin K
1.4µg
212.7µg
176%
Selenium
43µg
0.9µg
77%
Vitamin C
0mg
58.1mg
65%
Sodium
1174mg
3mg
51%
Vitamin B1
0.578mg
0.078mg
42%
Iron
4.73mg
1.6mg
39%
Vitamin B3
5.95mg
0.647mg
33%
Vitamin A
0µg
218µg
24%
Vitamin B2
0.421mg
0.115mg
24%
Fats
15.43g
0.73g
23%
Carbs
72.8g
4.35g
23%
Calories
475kcal
30kcal
22%
Monounsaturated fat
8.929g
0.095g
22%
Polyunsaturated fat
3.571g
0.267g
22%
Manganese
0.373mg
16%
Phosphorus
161mg
58mg
15%
Vitamin E
2.3mg
0.21mg
14%
Protein
8.11g
3.27g
10%
Saturated fat
2.229g
0.146g
9%
Zinc
1.4mg
0.56mg
8%
Calcium
20mg
92mg
7%
Potassium
120mg
296mg
5%
Fiber
3.7g
2.5g
5%
Vitamin B5
0.533mg
0.324mg
4%
Magnesium
52mg
42mg
2%
Vitamin B6
0.11mg
0.138mg
2%
Copper
0.167mg
0.157mg
1%
Choline
8.7mg
5.2mg
1%
Protein per 100 calories
1.7g
11g
N/A
Calories per 10 g protein
586kcal
92kcal
N/A
Weight per 100 calories
21g
333g
N/A
Unsaturated / Saturated Fat ratio
5.6
2.5
N/A
Net carbs
69.1g
1.85g
N/A
Sugar
5.71g
1.85g
N/A
Folate
106µg
105µg
0%
Trans fat
0.8g
0g
N/A
Tryptophan
0.037mg
0%
Threonine
0.128mg
0%
Isoleucine
0.139mg
0%
Leucine
0.195mg
0%
Lysine
0.163mg
0%
Methionine
0.036mg
0%
Phenylalanine
0.105mg
0%
Valine
0.145mg
0%
Histidine
0.057mg
0%
Macronutrient Comparison
Macronutrient breakdown side-by-side comparison
4
8%
15%
73%
2%
Protein:
8.11 g
Fats:
15.43 g
Carbs:
72.8 g
Water:
1.18 g
Other:
2.48 g
1
3%
4%
91%
Protein:
3.27 g
Fats:
0.73 g
Carbs:
4.35 g
Water:
90.65 g
Other:
1 g
Contains
more
Protein Protein
+148%
Contains
more
Fats Fats
+2013.7%
Contains
more
Carbs Carbs
+1573.6%
Contains
more
Other Other
+148%
Contains
more
Water Water
+7582.2%
Fat Type Comparison
Fat type breakdown side-by-side comparison
2
15%
61%
24%
Saturated fat:
Sat. Fat
2.229 g
Monounsaturated fat:
Mono. Fat
8.929 g
Polyunsaturated fat:
Poly. Fat
3.571 g
1
29%
19%
53%
Saturated fat:
Sat. Fat
0.146 g
Monounsaturated fat:
Mono. Fat
0.095 g
Polyunsaturated fat:
Poly. Fat
0.267 g
Contains
more
Mono. Fat Monounsaturated fat
+9298.9%
Contains
more
Poly. Fat Polyunsaturated fat
+1237.5%
Contains
less
Sat. Fat Saturated fat
-93.4%