Cocoa Pebbles Cereal vs. Cocoa Krispies — Health Impact and Nutrition Comparison


Summary
Cocoa Pebbles Cereal contains more vitamins, fats, and fewer sugars than Cocoa Krispies.
On the other hand, Cocoa Krispies are richer in minerals and have less sodium, saturated fat, and Vitamin C.
Introduction
This article will compare two famous breakfast cereal products, Cocoa Pebbles Cereal and Cocoa Krispies, focusing on their nutrition and health impact.
Nutrition
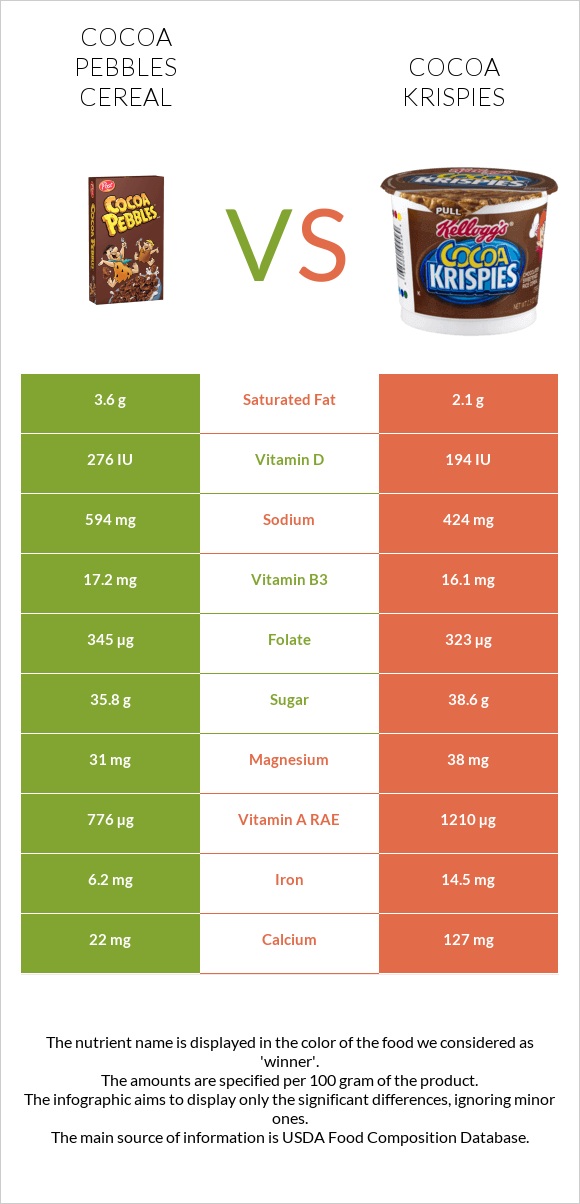
This section will examine the differences between Cocoa Pebbles Cereal and Cocoa Krispies' nutrients. Find the nutrition infographics at the bottom of the page
Calories
They are high and similar in caloric content.
Cocoa pebbles contain 397 calories per 100g, and cocoa Krispies contain 389 calories per 100g.
Fats
Cocoa Pebbles contain more fats than Cocoa Krispies.
They provide 4.1g of fat, while Cocoa Krispies provide 2.7g of fat.
Carbs
Both have high amounts of carbs. Cocoa Krispies have 87.9g of carbs per 100g, and cocoa pebbles contain 85.7g of carbs per 100g. If you're controlling your blood sugar levels, it's better to consider the serving size.
Fiber
Both have almost equal amounts of fiber. Cocoa Krispies have 1.4g of fiber, and cocoa pebbles contain 1.6g of fiber per 100g.
Vitamins
They are packed with vitamins and fall in the range of the top 9% of foods as a source of Vitamin B3, Vitamin B2, Vitamin B1, Vitamin B6, Vitamin B12, and folate.
Cocoa Krispies contain 80 times more Vitamin E. It is also high in Vitamin C and Vitamin A.
On the other hand, Cocoa Pebbles cereal contains 12 times more Vitamin K and more Vitamin D.
Vitamin Comparison
Contains
more
Vitamin DVitamin D
+43.8%
Contains
more
Vitamin KVitamin K
+1200%
Contains
more
Vitamin CVitamin C
+∞%
Contains
more
Vitamin AVitamin A
+55.9%
Contains
more
Vitamin EVitamin E
+8207.7%
Minerals
Cocoa Krispies have more minerals than Cocoa Pebbles Cereal.
Cocoa Krispies provide more magnesium, calcium, iron, copper, and magnesium and less sodium.
The amount of calcium is four times higher.
Cocoa Krispies are much richer in manganese than cocoa pebbles.
Mineral Comparison
Contains
more
MagnesiumMagnesium
+22.6%
Contains
more
CalciumCalcium
+477.3%
Contains
more
IronIron
+133.9%
Contains
more
CopperCopper
+10.7%
Contains
less
SodiumSodium
-28.6%
Contains
more
SeleniumSelenium
+15%
Health Impact
These cereals are nearly similar and differ in minerals and vitamins.
It is always best to consume them parallel to other complex carbs and proteins to increase satiety and remain full for longer.
If you are diabetic or prediabetic, it's best to consider the portion sizes and associate them with proteins.
Both products are deficient in cholesterol and fat. They are good sources of vitamins and minerals, including Vitamin B6, Folate, Vitamin B12, and Vitamin D. However, both are also high in carbs and calories. So, if you control your weight or blood sugar levels, be mindful of their consumption (1).
Infographic

All nutrients comparison - raw data values
| Nutrient |  |
 |
DV% diff. |
| Iron | 6.2mg | 14.5mg | 104% |
| Vitamin E | 0.13mg | 10.8mg | 71% |
| Vitamin C | 0mg | 48mg | 53% |
| Vitamin A | 776µg | 1210µg | 48% |
| Manganese | 1.1mg | 48% | |
| Starch | 43.8g | 18% | |
| Vitamin B12 | 5.2µg | 4.8µg | 17% |
| Calcium | 22mg | 127mg | 11% |
| Vitamin D | 6.9µg | 4.8µg | 11% |
| Vitamin D | 276 IU | 194 IU | 10% |
| Vitamin B2 | 1.5mg | 1.37mg | 10% |
| Vitamin B1 | 1.3mg | 1.21mg | 8% |
| Sodium | 594mg | 424mg | 7% |
| Vitamin B3 | 17.2mg | 16.1mg | 7% |
| Vitamin B6 | 1.7mg | 1.61mg | 7% |
| Saturated fat | 3.6g | 2.1g | 7% |
| Folate | 345µg | 323µg | 6% |
| Vitamin B5 | 0.249mg | 5% | |
| Copper | 0.3mg | 0.332mg | 4% |
| Selenium | 14µg | 16.1µg | 4% |
| Fats | 4.1g | 2.7g | 2% |
| Magnesium | 31mg | 38mg | 2% |
| Zinc | 5.2mg | 5mg | 2% |
| Carbs | 85.7g | 87.9g | 1% |
| Fiber | 1.6g | 1.4g | 1% |
| Phosphorus | 95mg | 102mg | 1% |
| Vitamin K | 1.3µg | 0.1µg | 1% |
| Choline | 3.8mg | 8.7mg | 1% |
| Caffeine | 2mg | 5mg | 1% |
| Calories | 397kcal | 389kcal | 0% |
| Protein | 4.8g | 4.6g | 0% |
| Net carbs | 84.1g | 86.5g | N/A |
| Potassium | 193mg | 197mg | 0% |
| Sugar | 35.8g | 38.6g | N/A |
| Trans fat | 0.1g | 0g | N/A |
| Monounsaturated fat | 0.2g | 0.3g | 0% |
| Polyunsaturated fat | 0.1g | 0.1g | 0% |
| Tryptophan | 0.08mg | 0% | |
| Threonine | 0.16mg | 0% | |
| Isoleucine | 0.16mg | 0% | |
| Leucine | 0.34mg | 0% | |
| Lysine | 0.13mg | 0% | |
| Methionine | 0.09mg | 0% | |
| Phenylalanine | 0.23mg | 0% | |
| Valine | 0.24mg | 0% | |
| Histidine | 0.09mg | 0% |
Macronutrient Comparison
| Contains more FatsFats | +51.9% |
| Contains more OtherOther | +45.7% |
| Contains more WaterWater | +12.4% |
Fat Type Comparison
| Contains less Sat. FatSaturated fat | -41.7% |
| Contains more Mono. FatMonounsaturated fat | +50% |
People also compare
References
All the values for which the sources are not specified explicitly are taken from FDA’s Food Central. The exact link to the food presented on this page can be found below.
All the Daily Values are presented for males aged 31-50, for 2000-calorie diets.


