Cookie Crisp Cereal vs. General Mills Count Chocula — In-Depth Nutrition Comparison
Compare
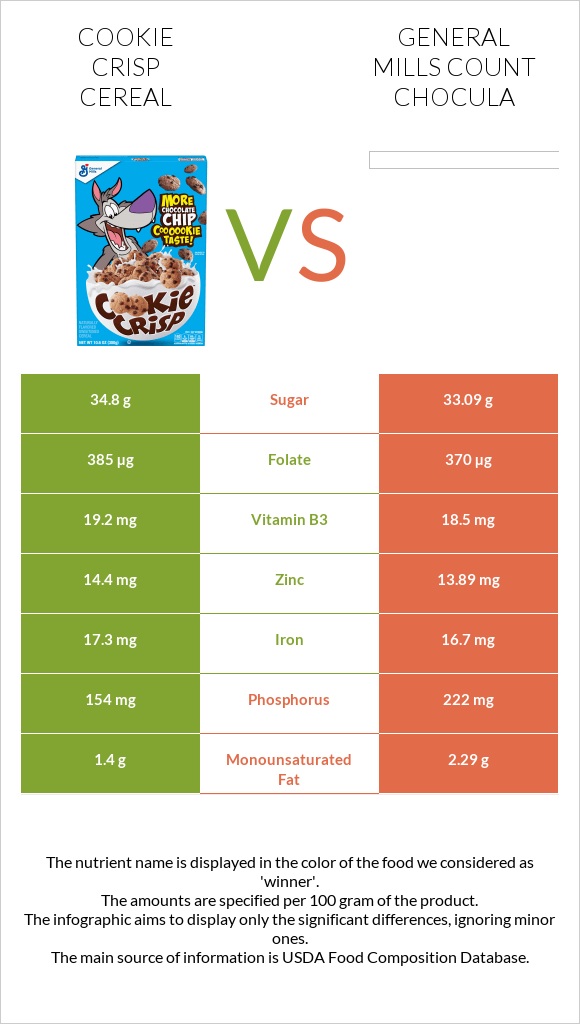
What are the differences between cookie Crisp Cereal and general Mills Count Chocula?
- Cookie Crisp Cereal is higher in vitamin B12, iron, copper, and vitamin B6, yet general Mills Count Chocula is higher in phosphorus and monounsaturated fat.
- The amount of sugar in general Mills Count Chocula is lower.
We used Cereals ready-to-eat, GENERAL MILLS, COOKIE CRISP and Cereals ready-to-eat, GENERAL MILLS, COUNT CHOCULA types in this article.
Infographic
Infographic link
Mineral Comparison
Mineral comparison score is based on the number of minerals by which one or the other food is richer. The "coverage" charts below show how much of the daily needs can be covered by 300 grams of the food.
| Contains more CopperCopper | +43.9% |
| Contains more ManganeseManganese | +∞% |
| Contains more SeleniumSelenium | +12.3% |
| Contains more PhosphorusPhosphorus | +44.2% |
Vitamin Comparison
Vitamin comparison score is based on the number of vitamins by which one or the other food is richer. The "coverage" charts below show how much of the daily needs can be covered by 300 grams of the food.
| Contains more Vitamin KVitamin K | +13.3% |
All nutrients comparison - raw data values
| Nutrient |  |
 |
DV% diff. |
| Manganese | 0.353mg | 15% | |
| Phosphorus | 154mg | 222mg | 10% |
| Vitamin B12 | 5.8µg | 5.59µg | 9% |
| Iron | 17.3mg | 16.7mg | 8% |
| Copper | 0.213mg | 0.148mg | 7% |
| Vitamin B6 | 1.923mg | 1.85mg | 6% |
| Zinc | 14.4mg | 13.89mg | 5% |
| Vitamin B3 | 19.2mg | 18.5mg | 4% |
| Folate | 385µg | 370µg | 4% |
| Calcium | 385mg | 370mg | 2% |
| Vitamin A | 546µg | 526µg | 2% |
| Monounsaturated fat | 1.4g | 2.29g | 2% |
| Vitamin C | 23.1mg | 22.2mg | 1% |
| Vitamin D* | 154 IU | 148 IU | 1% |
| Sodium | 457mg | 488mg | 1% |
| Selenium | 7.3µg | 6.5µg | 1% |
| Vitamin B1 | 1.4mg | 1.39mg | 1% |
| Saturated fat | 0.8g | 0.6g | 1% |
| Polyunsaturated fat | 1.7g | 1.6g | 1% |
| Caffeine | 4mg | 1mg | 1% |
| Calories | 380kcal | 383kcal | 0% |
| Protein | 5.2g | 5.4g | 0% |
| Protein per 100 calories | 1.4g | 1.4g | N/A |
| Calories per 10 g protein | 731kcal | 709kcal | N/A |
| Weight per 100 calories | 26g | 26g | N/A |
| Fats | 4.4g | 4.69g | 0% |
| Unsaturated / Saturated Fat ratio | 3.9 | 6.5 | N/A |
| Net carbs | 79.4g | 79.5g | N/A |
| Carbs | 84.5g | 84.5g | 0% |
| Vitamin D | 3.8µg | 3.7µg | 0% |
| Magnesium | 31mg | 30mg | 0% |
| Potassium | 231mg | 228mg | 0% |
| Sugar | 34.8g | 33.09g | N/A |
| Fiber | 5.1g | 5g | 0% |
| Vitamin E | 0.57mg | 0.62mg | 0% |
| Vitamin B2 | 1.6mg | 1.6mg | 0% |
| Vitamin B5 | 0.41mg | 0.42mg | 0% |
| Vitamin K | 1.5µg | 1.7µg | 0% |
| Trans fat | 0g | 0.1g | N/A |
| Choline | 12.8mg | 13.1mg | 0% |
Macronutrient Comparison
Macronutrient breakdown side-by-side comparison
Protein:
5.2 g
Fats:
4.4 g
Carbs:
84.5 g
Water:
2.3 g
Other:
3.6 g
Protein:
5.4 g
Fats:
4.69 g
Carbs:
84.5 g
Water:
1.89 g
Other:
3.52 g
| Contains more WaterWater | +21.7% |
~equal in
Protein
~5.4g
~equal in
Fats
~4.69g
~equal in
Carbs
~84.5g
~equal in
Other
~3.52g
Fat Type Comparison
Fat type breakdown side-by-side comparison
Saturated fat:
Sat. Fat
0.8 g
Monounsaturated fat:
Mono. Fat
1.4 g
Polyunsaturated fat:
Poly. Fat
1.7 g
Saturated fat:
Sat. Fat
0.6 g
Monounsaturated fat:
Mono. Fat
2.29 g
Polyunsaturated fat:
Poly. Fat
1.6 g
| Contains less Sat. FatSaturated fat | -25% |
| Contains more Mono. FatMonounsaturated fat | +63.6% |
~equal in
Polyunsaturated fat
~1.6g


