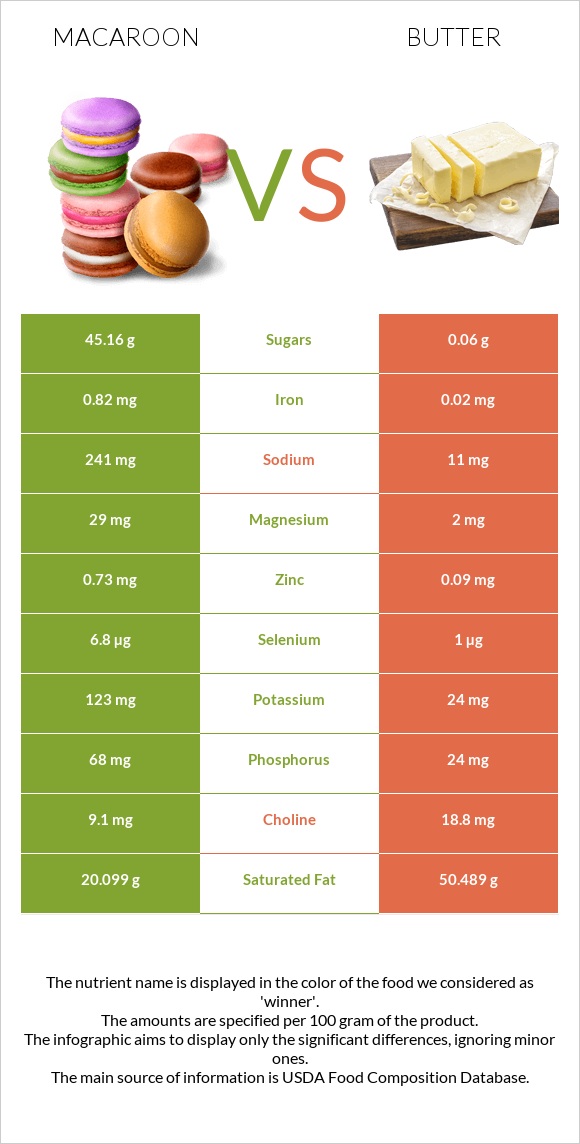
The main differences between macaroon and butter Macaroon is richer in copper, fiber, selenium, iron, and vitamin B6, yet butter is richer in vitamin A and vitamin E. Daily need coverage for saturated fat for butter is 152% higher. Butter contains less sodium. Butter has a lower glycemic index than macaroon. Food types used in this article are Cookies, coconut macaroon and Butter, without salt .
Infographic
Mineral Comparison
Mineral comparison score is based on the number of minerals by which one or the other food is richer. The "coverage" charts below show how much of the daily needs can be covered by 300 grams of the food.
7
100 g
300 g
2 cookie 1 serving - 36g
Magnesium
Magnesium
Calcium
Calcium
Potassium
Potassium
Iron
Iron
Copper
Copper
Zinc
Zinc
Phosphorus
Phosphorus
Sodium
Sodium
Manganese
Manganese
Selenium
Selenium
21%
1.5%
11%
31%
90%
20%
29%
31%
0%
37%
3
100 g
300 g
1 pat (1" sq, 1/3" high) - 5g 1 tbsp - 14.2g 1 stick - 113g 1 cup - 227g
Magnesium
Magnesium
Calcium
Calcium
Potassium
Potassium
Iron
Iron
Copper
Copper
Zinc
Zinc
Phosphorus
Phosphorus
Sodium
Sodium
Manganese
Manganese
Selenium
Selenium
1.4%
7.2%
2.1%
0.75%
5.3%
2.5%
10%
1.4%
0.52%
5.5%
Vitamin Comparison
Vitamin comparison score is based on the number of vitamins by which one or the other food is richer. The "coverage" charts below show how much of the daily needs can be covered by 300 grams of the food.
4
100 g
300 g
2 cookie 1 serving - 36g
Vitamin C
Vit. C
Vitamin D
Vit. D
Vitamin A
Vit. A
Vitamin E
Vit. E
Vitamin B1
Vit. B1
Vitamin B2
Vit. B2
Vitamin B3
Vit. B3
Vitamin B5
Vit. B5
Vitamin B6
Vit. B6
Vitamin B12
Vit. B12
Vitamin K
Vit. K
Folate
Folate
0%
0%
0%
3.8%
5%
14%
4.1%
0%
22%
0%
2.8%
2.3%
5
100 g
300 g
1 pat (1" sq, 1/3" high) - 5g 1 tbsp - 14.2g 1 stick - 113g 1 cup - 227g
Vitamin C
Vit. C
Vitamin D
Vit. D
Vitamin A
Vit. A
Vitamin E
Vit. E
Vitamin B1
Vit. B1
Vitamin B2
Vit. B2
Vitamin B3
Vit. B3
Vitamin B5
Vit. B5
Vitamin B6
Vit. B6
Vitamin B12
Vit. B12
Vitamin K
Vit. K
Folate
Folate
0%
0%
228%
46%
1.3%
7.8%
0.79%
6.6%
0.69%
21%
18%
2.3%
All nutrients comparison - raw data values
Nutrient
DV% diff.
Saturated fat
20.099g
50.489g
138%
Fats
22.55g
81.11g
90%
Vitamin A
0µg
684µg
76%
Cholesterol
0mg
215mg
72%
Monounsaturated fat
1.61g
23.43g
55%
Copper
0.269mg
0.016mg
28%
Carbs
61.22g
0.06g
20%
Fiber
5.1g
0g
20%
Polyunsaturated fat
0.81g
3.01g
15%
Vitamin E
0.19mg
2.32mg
14%
Calories
460kcal
717kcal
13%
Selenium
6.8µg
1µg
11%
Iron
0.82mg
0.02mg
10%
Sodium
241mg
11mg
10%
Vitamin B6
0.096mg
0.003mg
7%
Vitamin B12
0µg
0.17µg
7%
Magnesium
29mg
2mg
6%
Zinc
0.73mg
0.09mg
6%
Phosphorus
68mg
24mg
6%
Vitamin K
1.1µg
7µg
5%
Protein
3.02g
0.85g
4%
Potassium
123mg
24mg
3%
Calcium
5mg
24mg
2%
Vitamin B2
0.06mg
0.034mg
2%
Vitamin B5
0.11mg
2%
Choline
9.1mg
18.8mg
2%
Vitamin B1
0.02mg
0.005mg
1%
Vitamin B3
0.22mg
0.042mg
1%
Weight per 100 calories
22g
14g
N/A
Unsaturated / Saturated Fat ratio
0.12
0.52
N/A
Net carbs
56.12g
0.06g
N/A
Sugar
45.16g
0.06g
N/A
Manganese
0.004mg
0%
Folate
3µg
3µg
0%
Tryptophan
0.012mg
0%
Threonine
0.038mg
0%
Isoleucine
0.051mg
0%
Leucine
0.083mg
0%
Lysine
0.067mg
0%
Methionine
0.021mg
0%
Phenylalanine
0.041mg
0%
Valine
0.057mg
0%
Histidine
0.023mg
0%
Omega-3 - ALA
0.315g
N/A
Omega-6 - Linoleic acid
2.166g
N/A
Macronutrient Comparison
Macronutrient breakdown side-by-side comparison
3
3%
23%
61%
12%
2%
Protein:
3.02 g
Fats:
22.55 g
Carbs:
61.22 g
Water:
11.5 g
Other:
1.71 g
2
81%
18%
Protein:
0.85 g
Fats:
81.11 g
Carbs:
0.06 g
Water:
17.94 g
Other:
0.04 g
Contains
more
Protein Protein
+255.3%
Contains
more
Carbs Carbs
+101933.3%
Contains
more
Other Other
+4175%
Contains
more
Fats Fats
+259.7%
Contains
more
Water Water
+56%
Fat Type Comparison
Fat type breakdown side-by-side comparison
1
89%
7%
4%
Saturated fat:
Sat. Fat
20.099 g
Monounsaturated fat:
Mono. Fat
1.61 g
Polyunsaturated fat:
Poly. Fat
0.81 g
2
66%
30%
4%
Saturated fat:
Sat. Fat
50.489 g
Monounsaturated fat:
Mono. Fat
23.43 g
Polyunsaturated fat:
Poly. Fat
3.01 g
Contains
less
Sat. Fat Saturated fat
-60.2%
Contains
more
Mono. Fat Monounsaturated fat
+1355.3%
Contains
more
Poly. Fat Polyunsaturated fat
+271.6%