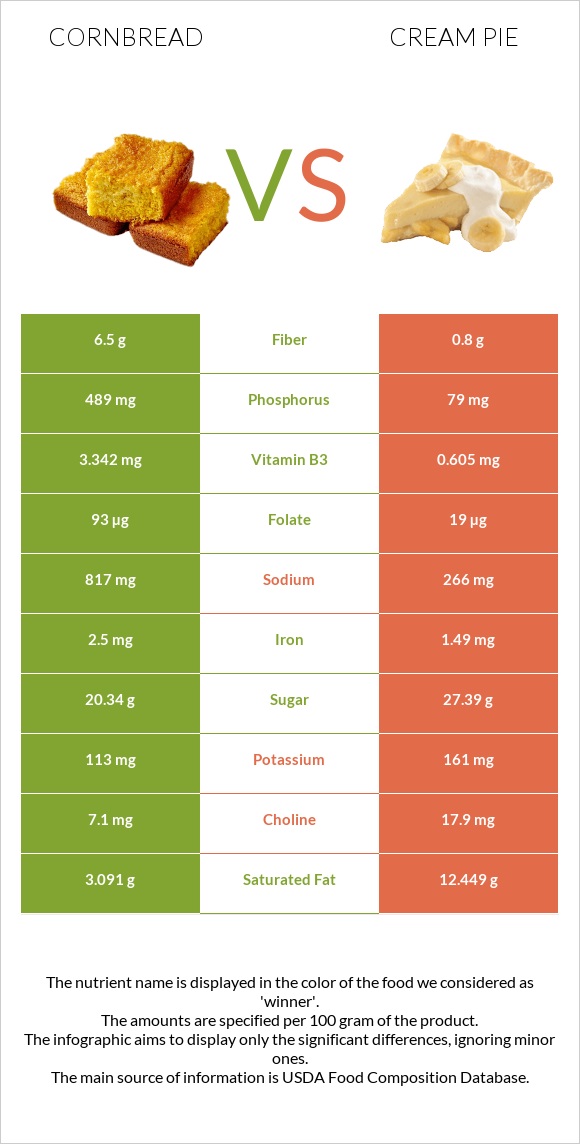
Summary of differences between cornbread and cream pie The amount of phosphorus, folate, vitamin B3, vitamin B1, choline, vitamin B5, and calcium in cornbread is higher than in cream pie. Cornbread covers your daily need for phosphorus, 45% more than cream pie. Cornbread contains 5 times more cholesterol than cream pie. While cornbread contains 57mg of cholesterol, cream pie contains only 12mg. These are the specific foods used in this comparison Bread, cornbread, dry mix, prepared with 2% milk, 80% margarine, and eggs and Pie, chocolate creme, commercially prepared .
Infographic
Mineral Comparison
Mineral comparison score is based on the number of minerals by which one or the other food is richer. The "coverage" charts below show how much of the daily needs can be covered by 300 grams of the food.
6
100 g
300 g
1 oz - 28.35g 1 muffin - 51g 1 piece - 60g
Magnesium
Magnesium
Calcium
Calcium
Potassium
Potassium
Iron
Iron
Copper
Copper
Zinc
Zinc
Phosphorus
Phosphorus
Sodium
Sodium
Manganese
Manganese
Selenium
Selenium
12%
41%
12%
69%
24%
18%
168%
78%
29%
47%
4
100 g
300 g
1 oz - 28.35g 1 piece (1/4 of 6" pie) - 99g 1 piece (1/6 of 8" pie) - 113g 1 serving .167 pie - 120g
Magnesium
Magnesium
Calcium
Calcium
Potassium
Potassium
Iron
Iron
Copper
Copper
Zinc
Zinc
Phosphorus
Phosphorus
Sodium
Sodium
Manganese
Manganese
Selenium
Selenium
14%
20%
14%
56%
39%
12%
34%
35%
21%
33%
Vitamin Comparison
Vitamin comparison score is based on the number of vitamins by which one or the other food is richer. The "coverage" charts below show how much of the daily needs can be covered by 300 grams of the food.
8
100 g
300 g
1 oz - 28.35g 1 muffin - 51g 1 piece - 60g
Vitamin C
Vit. C
Vitamin D
Vit. D
Vitamin A
Vit. A
Vitamin E
Vit. E
Vitamin B1
Vit. B1
Vitamin B2
Vit. B2
Vitamin B3
Vit. B3
Vitamin B5
Vit. B5
Vitamin B6
Vit. B6
Vitamin B12
Vit. B12
Vitamin K
Vit. K
Folate
Folate
0.33%
0%
12%
10%
48%
40%
38%
35%
20%
29%
9.3%
41%
4
100 g
300 g
1 oz - 28.35g 1 piece (1/4 of 6" pie) - 99g 1 piece (1/6 of 8" pie) - 113g 1 serving .167 pie - 120g
Vitamin C
Vit. C
Vitamin D
Vit. D
Vitamin A
Vit. A
Vitamin E
Vit. E
Vitamin B1
Vit. B1
Vitamin B2
Vit. B2
Vitamin B3
Vit. B3
Vitamin B5
Vit. B5
Vitamin B6
Vit. B6
Vitamin B12
Vit. B12
Vitamin K
Vit. K
Folate
Folate
0%
1.5%
15%
22%
22%
32%
11%
14%
4.6%
15%
24%
14%
All nutrients comparison - raw data values
Nutrient
DV% diff.
Phosphorus
391mg
79mg
45%
Saturated fat
3.732g
12.449g
40%
Fats
9.58g
22.41g
20%
Cholesterol
57mg
12mg
15%
Starch
35.66g
15%
Sodium
599mg
266mg
14%
Monounsaturated fat
3.494g
7.336g
10%
Vitamin B1
0.19mg
0.087mg
9%
Vitamin B3
2.004mg
0.605mg
9%
Folate
55µg
19µg
9%
Calcium
135mg
66mg
7%
Vitamin B5
0.579mg
0.232mg
7%
Choline
58.7mg
17.9mg
7%
Fiber
2.3g
0.8g
6%
Protein
6.59g
4.15g
5%
Carbs
54.46g
38.44g
5%
Iron
1.85mg
1.49mg
5%
Copper
0.073mg
0.118mg
5%
Selenium
8.7µg
6µg
5%
Vitamin B6
0.085mg
0.02mg
5%
Vitamin B12
0.23µg
0.12µg
5%
Vitamin K
3.7µg
9.5µg
5%
Polyunsaturated fat
1.963g
1.149g
5%
Vitamin E
0.51mg
1.09mg
4%
Manganese
0.222mg
0.161mg
3%
Vitamin B2
0.175mg
0.14mg
3%
Zinc
0.67mg
0.44mg
2%
Calories
330kcal
353kcal
1%
Vitamin D
0µg
0.1µg
1%
Potassium
133mg
161mg
1%
Vitamin A
35µg
46µg
1%
Protein per 100 calories
2g
1.2g
N/A
Calories per 10 g protein
501kcal
851kcal
N/A
Weight per 100 calories
30g
28g
N/A
Unsaturated / Saturated Fat ratio
1.5
0.68
N/A
Vitamin C
0.1mg
0mg
0%
Net carbs
52.16g
37.64g
N/A
Vitamin D*
0 IU
3 IU
0%
Magnesium
17mg
19mg
0%
Sugar
16.05g
27.39g
N/A
Trans fat
0.224g
2.49g
N/A
Tryptophan
0.059mg
0%
Threonine
0.226mg
0%
Isoleucine
0.265mg
0%
Leucine
0.658mg
0%
Lysine
0.324mg
0%
Methionine
0.157mg
0%
Phenylalanine
0.343mg
0%
Valine
0.334mg
0%
Histidine
0.167mg
0%
Fructose
0.2g
0%
Omega-3 - EPA
0g
0.001g
N/A
Omega-3 - DHA
0.007g
0g
N/A
Omega-3 - ALA
0.076g
N/A
Omega-3 - DPA
0.003g
0g
N/A
Omega-3 - Eicosatrienoic acid
0.004g
N/A
Omega-6 - Gamma-linoleic acid
0.004g
N/A
Omega-6 - Dihomo-gamma-linoleic acid
0.009g
N/A
Omega-6 - Eicosadienoic acid
0.043g
0g
N/A
Omega-6 - Linoleic acid
1.726g
N/A
Macronutrient Comparison
Macronutrient breakdown side-by-side comparison
3
7%
10%
54%
27%
2%
Protein:
6.59 g
Fats:
9.58 g
Carbs:
54.46 g
Water:
27.11 g
Other:
2.26 g
2
4%
22%
38%
34%
Protein:
4.15 g
Fats:
22.41 g
Carbs:
38.44 g
Water:
33.92 g
Other:
1.08 g
Contains
more
Protein Protein
+58.8%
Contains
more
Carbs Carbs
+41.7%
Contains
more
Other Other
+109.3%
Contains
more
Fats Fats
+133.9%
Contains
more
Water Water
+25.1%
Fat Type Comparison
Fat type breakdown side-by-side comparison
2
41%
38%
21%
Saturated fat:
Sat. Fat
3.732 g
Monounsaturated fat:
Mono. Fat
3.494 g
Polyunsaturated fat:
Poly. Fat
1.963 g
1
59%
35%
5%
Saturated fat:
Sat. Fat
12.449 g
Monounsaturated fat:
Mono. Fat
7.336 g
Polyunsaturated fat:
Poly. Fat
1.149 g
Contains
less
Sat. Fat Saturated fat
-70%
Contains
more
Poly. Fat Polyunsaturated fat
+70.8%
Contains
more
Mono. Fat Monounsaturated fat
+110%