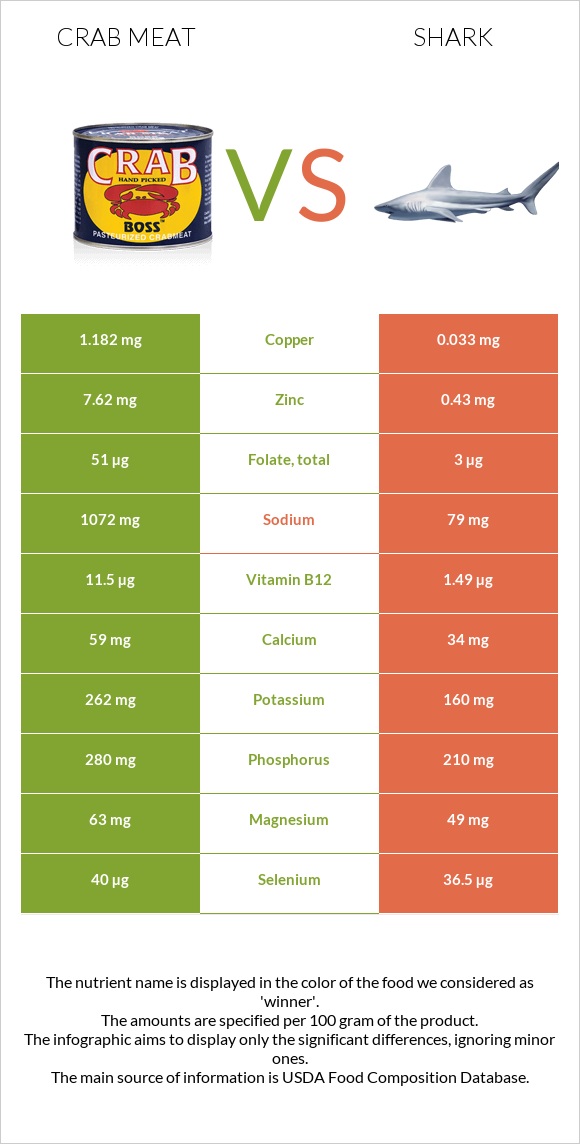
Summary of differences between crab meat and shark Crab meat has more vitamin B12, copper, zinc, phosphorus, selenium, and folate; however, shark is higher in vitamin B6 and vitamin B3. Crab meat covers your daily need for vitamin B12, 429% more than shark. Crab meat has 28 times more copper than shark. While crab meat has 1.182mg of copper, shark has only 0.042mg. Shark has less sodium. These are the specific foods used in this comparison Crustaceans, crab, alaska king, cooked, moist heat and Fish, shark, mixed species, cooked, batter-dipped and fried .
Infographic
Mineral Comparison
Mineral comparison score is based on the number of minerals by which one or the other food is richer. The "coverage" charts below show how much of the daily needs can be covered by 300 grams of the food.
7
100 g
300 g
3 oz - 85g 1 leg - 134g
Magnesium
Magnesium
Calcium
Calcium
Potassium
Potassium
Iron
Iron
Copper
Copper
Zinc
Zinc
Phosphorus
Phosphorus
Sodium
Sodium
Manganese
Manganese
Selenium
Selenium
45%
18%
23%
29%
394%
208%
120%
140%
5.2%
218%
3
100 g
300 g
3 oz - 85g
Magnesium
Magnesium
Calcium
Calcium
Potassium
Potassium
Iron
Iron
Copper
Copper
Zinc
Zinc
Phosphorus
Phosphorus
Sodium
Sodium
Manganese
Manganese
Selenium
Selenium
31%
15%
14%
42%
14%
13%
83%
16%
6.5%
185%
Vitamin Comparison
Vitamin comparison score is based on the number of vitamins by which one or the other food is richer. The "coverage" charts below show how much of the daily needs can be covered by 300 grams of the food.
3
100 g
300 g
3 oz - 85g 1 leg - 134g
Vitamin C
Vit. C
Vitamin D
Vit. D
Vitamin A
Vit. A
Vitamin E
Vit. E
Vitamin B1
Vit. B1
Vitamin B2
Vit. B2
Vitamin B3
Vit. B3
Vitamin B5
Vit. B5
Vitamin B6
Vit. B6
Vitamin B12
Vit. B12
Vitamin K
Vit. K
Folate
Folate
25%
0%
3%
0%
13%
13%
25%
24%
42%
1438%
0%
38%
6
100 g
300 g
3 oz - 85g
Vitamin C
Vit. C
Vitamin D
Vit. D
Vitamin A
Vit. A
Vitamin E
Vit. E
Vitamin B1
Vit. B1
Vitamin B2
Vit. B2
Vitamin B3
Vit. B3
Vitamin B5
Vit. B5
Vitamin B6
Vit. B6
Vitamin B12
Vit. B12
Vitamin K
Vit. K
Folate
Folate
0%
0%
18%
0%
18%
22%
52%
37%
69%
151%
0%
11%
All nutrients comparison - raw data values
Nutrient
DV% diff.
Vitamin B12
11.5µg
1.21µg
429%
Copper
1.182mg
0.042mg
127%
Zinc
7.62mg
0.48mg
65%
Sodium
1072mg
122mg
41%
Polyunsaturated fat
0.536g
3.701g
21%
Fats
1.54g
13.82g
19%
Saturated fat
0.133g
3.205g
14%
Monounsaturated fat
0.185g
5.935g
14%
Phosphorus
280mg
194mg
12%
Selenium
40µg
34µg
11%
Vitamin B3
1.34mg
2.783mg
9%
Vitamin B6
0.18mg
0.3mg
9%
Folate
51µg
15µg
9%
Vitamin C
7.6mg
0mg
8%
Calories
97kcal
228kcal
7%
Magnesium
63mg
43mg
5%
Vitamin A
9µg
54µg
5%
Iron
0.76mg
1.11mg
4%
Vitamin B5
0.4mg
0.62mg
4%
Potassium
262mg
155mg
3%
Vitamin B2
0.055mg
0.097mg
3%
Carbs
0g
6.39g
2%
Cholesterol
53mg
59mg
2%
Vitamin B1
0.053mg
0.072mg
2%
Protein
19.35g
18.62g
1%
Calcium
59mg
50mg
1%
Protein per 100 calories
20g
8.2g
N/A
Calories per 10 g protein
50kcal
122kcal
N/A
Weight per 100 calories
103g
44g
N/A
Unsaturated / Saturated Fat ratio
5.4
3
N/A
Net carbs
0g
6.39g
N/A
Manganese
0.04mg
0.05mg
0%
Tryptophan
0.269mg
0.212mg
0%
Threonine
0.783mg
0.843mg
0%
Isoleucine
0.938mg
0.867mg
0%
Leucine
1.536mg
1.515mg
0%
Lysine
1.684mg
1.634mg
0%
Methionine
0.545mg
0.541mg
0%
Phenylalanine
0.817mg
0.75mg
0%
Valine
0.91mg
0.965mg
0%
Histidine
0.393mg
0.538mg
0%
Omega-3 - EPA
0.295g
0.258g
N/A
Omega-3 - DHA
0.118g
0.431g
N/A
Omega-3 - DPA
0.031g
0.089g
N/A
Macronutrient Comparison
Macronutrient breakdown side-by-side comparison
3
19%
78%
Protein:
19.35 g
Fats:
1.54 g
Carbs:
0 g
Water:
77.55 g
Other:
1.56 g
2
19%
14%
6%
60%
Protein:
18.62 g
Fats:
13.82 g
Carbs:
6.39 g
Water:
60.09 g
Other:
1.08 g
Contains
more
Water Water
+29.1%
Contains
more
Other Other
+44.4%
Contains
more
Fats Fats
+797.4%
Contains
more
Carbs Carbs
+∞%
~equal in
Protein
~18.62g
Fat Type Comparison
Fat type breakdown side-by-side comparison
1
16%
22%
63%
Saturated fat:
Sat. Fat
0.133 g
Monounsaturated fat:
Mono. Fat
0.185 g
Polyunsaturated fat:
Poly. Fat
0.536 g
2
25%
46%
29%
Saturated fat:
Sat. Fat
3.205 g
Monounsaturated fat:
Mono. Fat
5.935 g
Polyunsaturated fat:
Poly. Fat
3.701 g
Contains
less
Sat. Fat Saturated fat
-95.9%
Contains
more
Mono. Fat Monounsaturated fat
+3108.1%
Contains
more
Poly. Fat Polyunsaturated fat
+590.5%