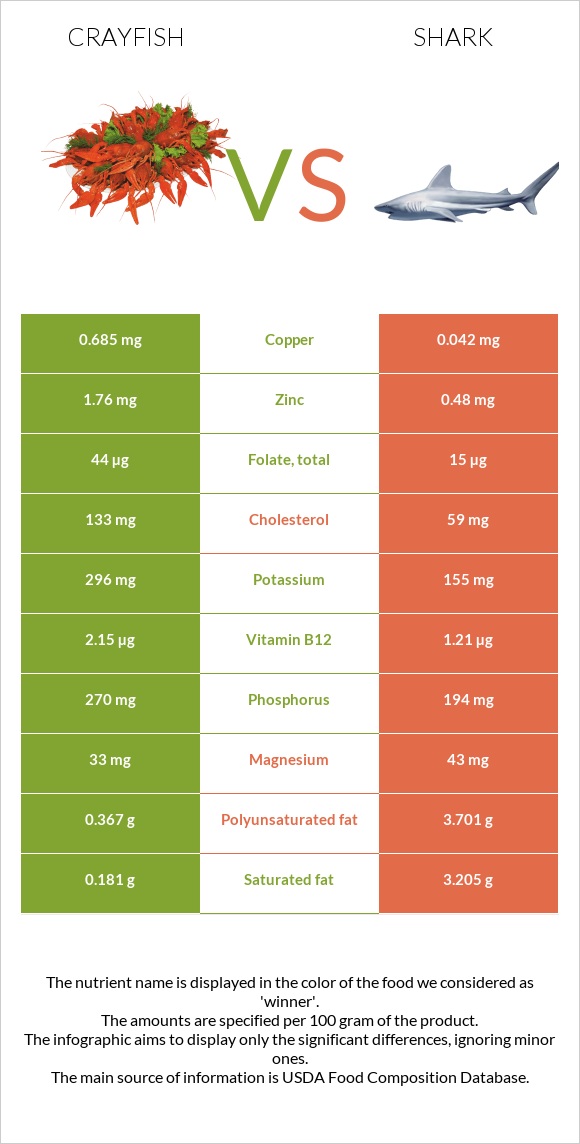
Important differences between crayfish and shark Crayfish has more copper, vitamin B12, manganese, zinc, phosphorus, and folate; however, shark has more vitamin B6. Crayfish's daily need coverage for copper is 71% more. Crayfish has 10 times more manganese than shark. Crayfish has 0.522mg of manganese, while shark has 0.05mg. Shark is lower in cholesterol. The food varieties used in the comparison are Crustaceans, crayfish, mixed species, wild, cooked, moist heat and Fish, shark, mixed species, cooked, batter-dipped and fried .
Infographic
Mineral Comparison
Mineral comparison score is based on the number of minerals by which one or the other food is richer. The "coverage" charts below show how much of the daily needs can be covered by 300 grams of the food.
7
100 g
300 g
3 oz - 85g
Magnesium
Magnesium
Calcium
Calcium
Potassium
Potassium
Iron
Iron
Copper
Copper
Zinc
Zinc
Phosphorus
Phosphorus
Sodium
Sodium
Manganese
Manganese
Selenium
Selenium
24%
18%
26%
31%
228%
48%
116%
12%
68%
200%
2
100 g
300 g
3 oz - 85g
Magnesium
Magnesium
Calcium
Calcium
Potassium
Potassium
Iron
Iron
Copper
Copper
Zinc
Zinc
Phosphorus
Phosphorus
Sodium
Sodium
Manganese
Manganese
Selenium
Selenium
31%
15%
14%
42%
14%
13%
83%
16%
6.5%
185%
Vitamin Comparison
Vitamin comparison score is based on the number of vitamins by which one or the other food is richer. The "coverage" charts below show how much of the daily needs can be covered by 300 grams of the food.
5
100 g
300 g
3 oz - 85g
Vitamin C
Vit. C
Vitamin D
Vit. D
Vitamin A
Vit. A
Vitamin E
Vit. E
Vitamin B1
Vit. B1
Vitamin B2
Vit. B2
Vitamin B3
Vit. B3
Vitamin B5
Vit. B5
Vitamin B6
Vit. B6
Vitamin B12
Vit. B12
Vitamin K
Vit. K
Folate
Folate
3%
0%
5%
30%
13%
20%
43%
35%
18%
269%
0.25%
33%
5
100 g
300 g
3 oz - 85g
Vitamin C
Vit. C
Vitamin D
Vit. D
Vitamin A
Vit. A
Vitamin E
Vit. E
Vitamin B1
Vit. B1
Vitamin B2
Vit. B2
Vitamin B3
Vit. B3
Vitamin B5
Vit. B5
Vitamin B6
Vit. B6
Vitamin B12
Vit. B12
Vitamin K
Vit. K
Folate
Folate
0%
0%
18%
0%
18%
22%
52%
37%
69%
151%
0%
11%
All nutrients comparison - raw data values
Nutrient
DV% diff.
Copper
0.685mg
0.042mg
71%
Vitamin B12
2.15µg
1.21µg
39%
Cholesterol
133mg
59mg
25%
Polyunsaturated fat
0.367g
3.701g
22%
Manganese
0.522mg
0.05mg
21%
Fats
1.2g
13.82g
19%
Vitamin B6
0.076mg
0.3mg
17%
Choline
80.9mg
15%
Saturated fat
0.181g
3.205g
14%
Monounsaturated fat
0.244g
5.935g
14%
Zinc
1.76mg
0.48mg
12%
Phosphorus
270mg
194mg
11%
Vitamin E
1.5mg
10%
Calories
82kcal
228kcal
7%
Folate
44µg
15µg
7%
Selenium
36.7µg
34µg
5%
Protein
16.77g
18.62g
4%
Potassium
296mg
155mg
4%
Iron
0.83mg
1.11mg
4%
Vitamin A
15µg
54µg
4%
Vitamin B3
2.28mg
2.783mg
3%
Carbs
0g
6.39g
2%
Magnesium
33mg
43mg
2%
Vitamin B1
0.05mg
0.072mg
2%
Vitamin C
0.9mg
0mg
1%
Calcium
60mg
50mg
1%
Sodium
94mg
122mg
1%
Vitamin B2
0.085mg
0.097mg
1%
Vitamin B5
0.58mg
0.62mg
1%
Protein per 100 calories
20g
8.2g
N/A
Calories per 10 g protein
49kcal
122kcal
N/A
Weight per 100 calories
122g
44g
N/A
Unsaturated / Saturated Fat ratio
3.4
3
N/A
Net carbs
0g
6.39g
N/A
Vitamin K
0.1µg
0%
Tryptophan
0.234mg
0.212mg
0%
Threonine
0.676mg
0.843mg
0%
Isoleucine
0.811mg
0.867mg
0%
Leucine
1.329mg
1.515mg
0%
Lysine
1.457mg
1.634mg
0%
Methionine
0.472mg
0.541mg
0%
Phenylalanine
0.706mg
0.75mg
0%
Valine
0.786mg
0.965mg
0%
Histidine
0.341mg
0.538mg
0%
Omega-3 - EPA
0.119g
0.258g
N/A
Omega-3 - DHA
0.047g
0.431g
N/A
Omega-3 - DPA
0g
0.089g
N/A
Macronutrient Comparison
Macronutrient breakdown side-by-side comparison
2
17%
79%
3%
Protein:
16.77 g
Fats:
1.2 g
Carbs:
0 g
Water:
79.37 g
Other:
2.66 g
3
19%
14%
6%
60%
Protein:
18.62 g
Fats:
13.82 g
Carbs:
6.39 g
Water:
60.09 g
Other:
1.08 g
Contains
more
Water Water
+32.1%
Contains
more
Other Other
+146.3%
Contains
more
Protein Protein
+11%
Contains
more
Fats Fats
+1051.7%
Contains
more
Carbs Carbs
+∞%
Fat Type Comparison
Fat type breakdown side-by-side comparison
1
23%
31%
46%
Saturated fat:
Sat. Fat
0.181 g
Monounsaturated fat:
Mono. Fat
0.244 g
Polyunsaturated fat:
Poly. Fat
0.367 g
2
25%
46%
29%
Saturated fat:
Sat. Fat
3.205 g
Monounsaturated fat:
Mono. Fat
5.935 g
Polyunsaturated fat:
Poly. Fat
3.701 g
Contains
less
Sat. Fat Saturated fat
-94.4%
Contains
more
Mono. Fat Monounsaturated fat
+2332.4%
Contains
more
Poly. Fat Polyunsaturated fat
+908.4%