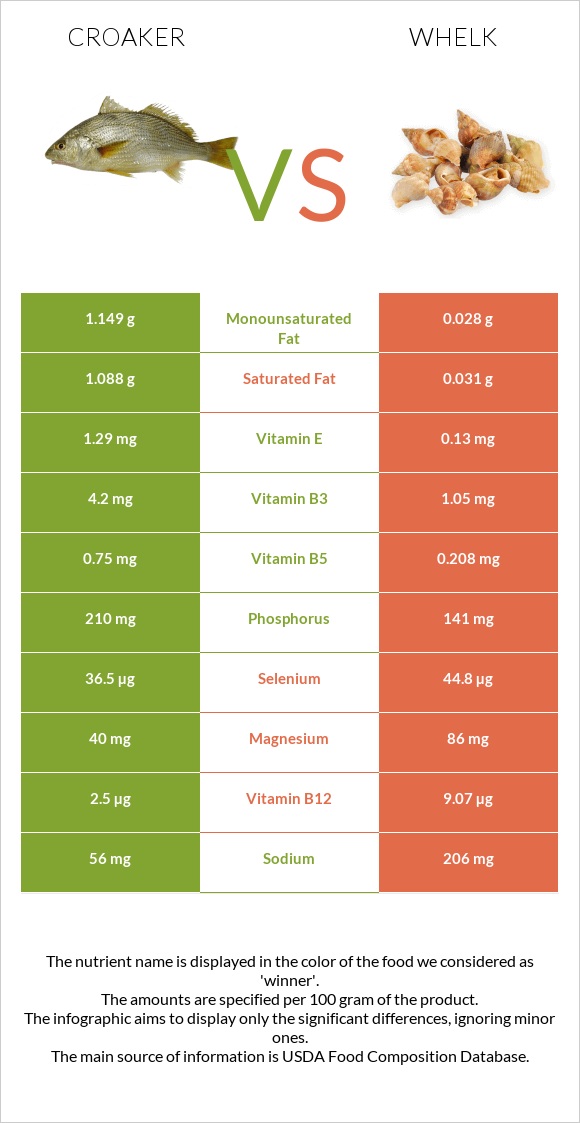
How are croaker and whelk different? Whelk has more vitamin B12, copper, iron, selenium, manganese, magnesium, vitamin B6, and zinc than croaker. Daily need coverage for vitamin B12 for whelk is 668% higher. Croaker contains 56 times more saturated fat than whelk. While croaker contains 3.476g of saturated fat, whelk contains only 0.062g. Fish, croaker, Atlantic, cooked, breaded, and fried and Mollusks, whelk, unspecified, cooked, moist heat are the varieties used in this article.
Infographic
Mineral Comparison
Mineral comparison score is based on the number of minerals by which one or the other food is richer. The "coverage" charts below show how much of the daily needs can be covered by 300 grams of the food.
1
100 g
300 g
3 oz - 85g 1 fillet - 87g
Magnesium
Magnesium
Calcium
Calcium
Potassium
Potassium
Iron
Iron
Copper
Copper
Zinc
Zinc
Phosphorus
Phosphorus
Sodium
Sodium
Manganese
Manganese
Selenium
Selenium
30%
9.6%
30%
32%
22%
14%
93%
45%
10%
212%
9
100 g
300 g
3 oz - 85g
Magnesium
Magnesium
Calcium
Calcium
Potassium
Potassium
Iron
Iron
Copper
Copper
Zinc
Zinc
Phosphorus
Phosphorus
Sodium
Sodium
Manganese
Manganese
Selenium
Selenium
123%
34%
61%
377%
687%
89%
121%
54%
116%
489%
Vitamin Comparison
Vitamin comparison score is based on the number of vitamins by which one or the other food is richer. The "coverage" charts below show how much of the daily needs can be covered by 300 grams of the food.
4
100 g
300 g
3 oz - 85g 1 fillet - 87g
Vitamin C
Vit. C
Vitamin D
Vit. D
Vitamin A
Vit. A
Vitamin E
Vit. E
Vitamin B1
Vit. B1
Vitamin B2
Vit. B2
Vitamin B3
Vit. B3
Vitamin B5
Vit. B5
Vitamin B6
Vit. B6
Vitamin B12
Vit. B12
Vitamin K
Vit. K
Folate
Folate
0%
0%
7.7%
0%
23%
30%
81%
44%
60%
263%
0%
26%
5
100 g
300 g
3 oz - 85g
Vitamin C
Vit. C
Vitamin D
Vit. D
Vitamin A
Vit. A
Vitamin E
Vit. E
Vitamin B1
Vit. B1
Vitamin B2
Vit. B2
Vitamin B3
Vit. B3
Vitamin B5
Vit. B5
Vitamin B6
Vit. B6
Vitamin B12
Vit. B12
Vitamin K
Vit. K
Folate
Folate
23%
0%
16%
0%
12%
49%
37%
24%
150%
2268%
0%
8.3%
All nutrients comparison - raw data values
Nutrient
DV% diff.
Vitamin B12
2.1µg
18.14µg
668%
Copper
0.065mg
2.06mg
222%
Iron
0.86mg
10.06mg
115%
Selenium
38.8µg
89.6µg
92%
Protein
18.2g
47.68g
59%
Manganese
0.08mg
0.89mg
35%
Magnesium
42mg
172mg
31%
Vitamin B6
0.26mg
0.65mg
30%
Zinc
0.52mg
3.26mg
25%
Polyunsaturated fat
2.917g
0.046g
19%
Fats
12.67g
0.8g
18%
Saturated fat
3.476g
0.062g
16%
Cholesterol
84mg
130mg
15%
Vitamin B3
4.3mg
1.995mg
14%
Monounsaturated fat
5.32g
0.056g
13%
Potassium
340mg
694mg
10%
Phosphorus
217mg
282mg
9%
Vitamin C
0mg
6.8mg
8%
Calcium
32mg
113mg
8%
Vitamin B5
0.74mg
0.4mg
7%
Vitamin B2
0.13mg
0.214mg
6%
Folate
34µg
11µg
6%
Calories
221kcal
275kcal
3%
Carbs
7.54g
15.52g
3%
Sodium
348mg
412mg
3%
Vitamin A
23µg
49µg
3%
Vitamin B1
0.09mg
0.049mg
3%
Fiber
0.4g
0g
2%
Protein per 100 calories
8.2g
17g
N/A
Calories per 10 g protein
121kcal
58kcal
N/A
Weight per 100 calories
45g
36g
N/A
Unsaturated / Saturated Fat ratio
2.4
1.6
N/A
Net carbs
7.14g
15.52g
N/A
Tryptophan
0.208mg
0.618mg
0%
Threonine
0.788mg
2.136mg
0%
Isoleucine
0.847mg
1.655mg
0%
Leucine
1.48mg
3.807mg
0%
Lysine
1.571mg
2.93mg
0%
Methionine
0.525mg
1.205mg
0%
Phenylalanine
0.742mg
1.648mg
0%
Valine
0.947mg
2.075mg
0%
Histidine
0.525mg
0.977mg
0%
Omega-3 - EPA
0.113g
0.008g
N/A
Omega-3 - DHA
0.089g
0.012g
N/A
Omega-3 - DPA
0.079g
N/A
Macronutrient Comparison
Macronutrient breakdown side-by-side comparison
2
18%
13%
8%
60%
2%
Protein:
18.2 g
Fats:
12.67 g
Carbs:
7.54 g
Water:
59.76 g
Other:
1.83 g
3
48%
16%
32%
4%
Protein:
47.68 g
Fats:
0.8 g
Carbs:
15.52 g
Water:
32 g
Other:
4 g
Contains
more
Fats Fats
+1483.8%
Contains
more
Water Water
+86.8%
Contains
more
Protein Protein
+162%
Contains
more
Carbs Carbs
+105.8%
Contains
more
Other Other
+118.6%
Fat Type Comparison
Fat type breakdown side-by-side comparison
2
30%
45%
25%
Saturated fat:
Sat. Fat
3.476 g
Monounsaturated fat:
Mono. Fat
5.32 g
Polyunsaturated fat:
Poly. Fat
2.917 g
1
38%
34%
28%
Saturated fat:
Sat. Fat
0.062 g
Monounsaturated fat:
Mono. Fat
0.056 g
Polyunsaturated fat:
Poly. Fat
0.046 g
Contains
more
Mono. Fat Monounsaturated fat
+9400%
Contains
more
Poly. Fat Polyunsaturated fat
+6241.3%
Contains
less
Sat. Fat Saturated fat
-98.2%