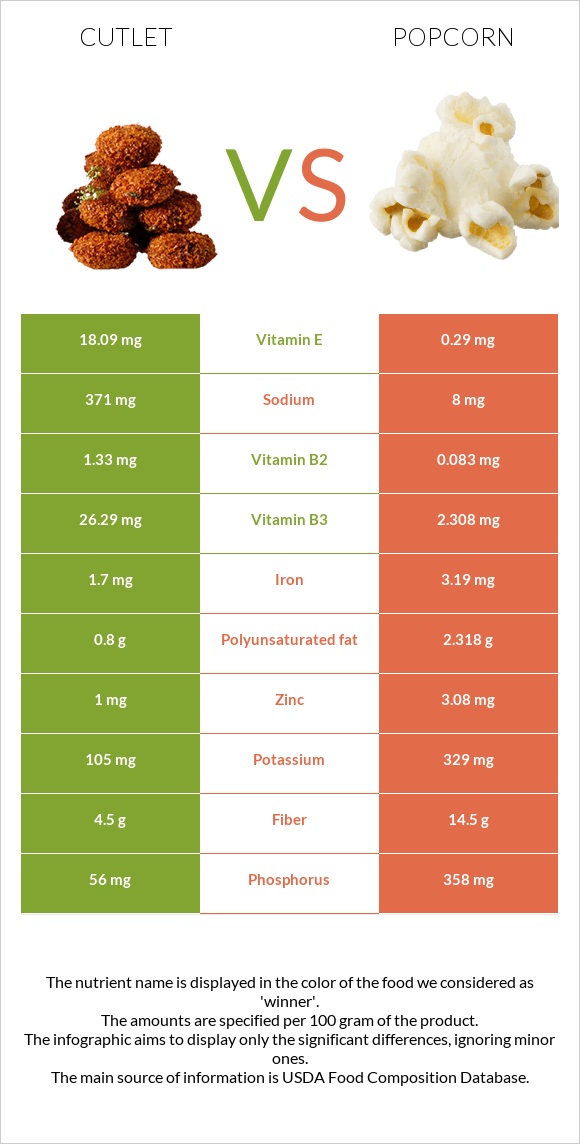
Significant differences between cutlet and popcorn Cutlet has more vitamin B3, vitamin E, vitamin B2, and vitamin B6; however, popcorn is richer in phosphorus, fiber, magnesium, zinc, and iron. Cutlet covers your daily vitamin B3 needs 150% more than popcorn. Popcorn has 62 times less vitamin E than cutlet. Cutlet has 18.09mg of vitamin E, while popcorn has 0.29mg. Popcorn contains less sodium. Popcorn has a higher glycemic index. The glycemic index of popcorn is 62, while the glycemic index of cutlet is 0. Specific food types used in this comparison are WORTHINGTON Multigrain Cutlets, canned, unprepared and Snacks, popcorn, air-popped .
Infographic
Mineral Comparison
Mineral comparison score is based on the number of minerals by which one or the other food is richer. The "coverage" charts below show how much of the daily needs can be covered by 300 grams of the food.
1
100 g
300 g
2 slices - 92g
Magnesium
Magnesium
Calcium
Calcium
Potassium
Potassium
Iron
Iron
Copper
Copper
Zinc
Zinc
Phosphorus
Phosphorus
Sodium
Sodium
Manganese
Manganese
Selenium
Selenium
2.1%
6.6%
9.3%
64%
0%
27%
24%
48%
0%
0%
8
100 g
300 g
1 cup - 8g 1 oz - 28.35g
Magnesium
Magnesium
Calcium
Calcium
Potassium
Potassium
Iron
Iron
Copper
Copper
Zinc
Zinc
Phosphorus
Phosphorus
Sodium
Sodium
Manganese
Manganese
Selenium
Selenium
103%
2.1%
29%
120%
87%
84%
153%
1%
145%
0%
Vitamin Comparison
Vitamin comparison score is based on the number of vitamins by which one or the other food is richer. The "coverage" charts below show how much of the daily needs can be covered by 300 grams of the food.
4
100 g
300 g
2 slices - 92g
Vitamin C
Vit. C
Vitamin D
Vit. D
Vitamin A
Vit. A
Vitamin E
Vit. E
Vitamin B1
Vit. B1
Vitamin B2
Vit. B2
Vitamin B3
Vit. B3
Vitamin B5
Vit. B5
Vitamin B6
Vit. B6
Vitamin B12
Vit. B12
Vitamin K
Vit. K
Folate
Folate
0%
0%
0%
362%
13%
307%
493%
0%
115%
0%
0%
1.5%
5
100 g
300 g
1 cup - 8g 1 oz - 28.35g
Vitamin C
Vit. C
Vitamin D
Vit. D
Vitamin A
Vit. A
Vitamin E
Vit. E
Vitamin B1
Vit. B1
Vitamin B2
Vit. B2
Vitamin B3
Vit. B3
Vitamin B5
Vit. B5
Vitamin B6
Vit. B6
Vitamin B12
Vit. B12
Vitamin K
Vit. K
Folate
Folate
0%
0%
3.3%
5.8%
26%
19%
43%
31%
36%
0%
3%
23%
All nutrients comparison - raw data values
Nutrient
DV% diff.
Vitamin B3
26.29mg
2.308mg
150%
Vitamin E
18.09mg
0.29mg
119%
Vitamin B2
1.33mg
0.083mg
96%
Manganese
1.113mg
48%
Phosphorus
56mg
358mg
43%
Fiber
4.5g
14.5g
40%
Magnesium
3mg
144mg
34%
Copper
0.262mg
29%
Vitamin B6
0.5mg
0.157mg
26%
Carbs
7.3g
77.78g
23%
Starch
54.4g
22%
Protein
23.29g
12.94g
21%
Iron
1.7mg
3.19mg
19%
Zinc
1mg
3.08mg
19%
Sodium
371mg
8mg
16%
Calories
117kcal
387kcal
14%
Vitamin B5
0.51mg
10%
Polyunsaturated fat
0.8g
2.318g
10%
Potassium
105mg
329mg
7%
Folate
2µg
31µg
7%
Fats
1.5g
4.54g
5%
Vitamin B1
0.05mg
0.104mg
5%
Choline
21.2mg
4%
Calcium
22mg
7mg
2%
Saturated fat
0.3g
0.637g
2%
Monounsaturated fat
0.2g
0.95g
2%
Vitamin A
10µg
1%
Vitamin K
1.2µg
1%
Protein per 100 calories
20g
3.3g
N/A
Calories per 10 g protein
50kcal
299kcal
N/A
Weight per 100 calories
85g
26g
N/A
Unsaturated / Saturated Fat ratio
3.3
5.1
N/A
Net carbs
2.8g
63.28g
N/A
Sugar
0.2g
0.87g
N/A
Tryptophan
0.085mg
0%
Threonine
0.452mg
0%
Isoleucine
0.431mg
0%
Leucine
1.473mg
0%
Lysine
0.338mg
0%
Methionine
0.252mg
0%
Phenylalanine
0.59mg
0%
Valine
0.607mg
0%
Histidine
0.367mg
0%
Fructose
0.07g
0%
Macronutrient Comparison
Macronutrient breakdown side-by-side comparison
2
23%
7%
67%
Protein:
23.29 g
Fats:
1.5 g
Carbs:
7.3 g
Water:
66.69 g
Other:
1.22 g
3
13%
5%
78%
3%
Protein:
12.94 g
Fats:
4.54 g
Carbs:
77.78 g
Water:
3.32 g
Other:
1.42 g
Contains
more
Protein Protein
+80%
Contains
more
Water Water
+1908.7%
Contains
more
Fats Fats
+202.7%
Contains
more
Carbs Carbs
+965.5%
Contains
more
Other Other
+16.4%
Fat Type Comparison
Fat type breakdown side-by-side comparison
1
23%
15%
62%
Saturated fat:
Sat. Fat
0.3 g
Monounsaturated fat:
Mono. Fat
0.2 g
Polyunsaturated fat:
Poly. Fat
0.8 g
2
16%
24%
59%
Saturated fat:
Sat. Fat
0.637 g
Monounsaturated fat:
Mono. Fat
0.95 g
Polyunsaturated fat:
Poly. Fat
2.318 g
Contains
less
Sat. Fat Saturated fat
-52.9%
Contains
more
Mono. Fat Monounsaturated fat
+375%
Contains
more
Poly. Fat Polyunsaturated fat
+189.8%