Devilfish vs. Sardines — In-Depth Nutrition Comparison
Compare
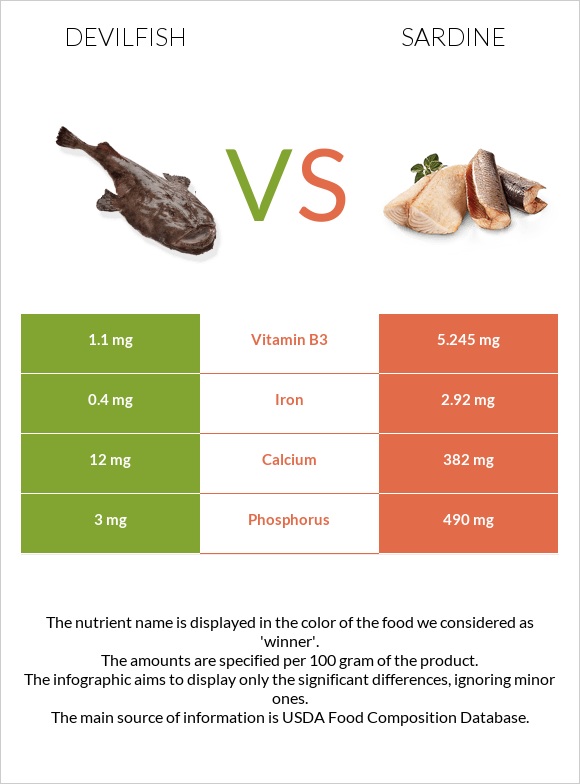
Important differences between devilfish and sardines
- Devilfish has more vitamin A; however, sardines have more phosphorus, calcium, iron, vitamin B3, and vitamin B2.
- Sardines' daily need coverage for phosphorus is 70% more.
- Devilfish has 9 times more vitamin A than sardines. Devilfish has 1020 IU of vitamin A, while sardines have 108 IU.
The food varieties used in the comparison are Fish, devilfish, meat (Alaska Native) and Fish, sardine, Atlantic, canned in oil, drained solids with bone.
Infographic
Infographic link
Mineral Comparison
Mineral comparison score is based on the number of minerals by which one or the other food is richer. The "coverage" charts below show how much of the daily needs can be covered by 300 grams of the food.
| Contains less SodiumSodium | -100% |
| Contains more CalciumCalcium | +3083.3% |
| Contains more IronIron | +630% |
| Contains more PhosphorusPhosphorus | +16233.3% |
Vitamin Comparison
Vitamin comparison score is based on the number of vitamins by which one or the other food is richer. The "coverage" charts below show how much of the daily needs can be covered by 300 grams of the food.
| Contains more Vitamin CVitamin C | +∞% |
| Contains more Vitamin B1Vitamin B1 | +12.5% |
| Contains more Vitamin B2Vitamin B2 | +127% |
| Contains more Vitamin B3Vitamin B3 | +376.8% |
All nutrients comparison - raw data values
| Nutrient |  |
 |
DV% diff. |
| Vitamin B12 | 8.94µg | 373% | |
| Selenium | 52.7µg | 96% | |
| Phosphorus | 3mg | 490mg | 70% |
| Cholesterol | 142mg | 47% | |
| Calcium | 12mg | 382mg | 37% |
| Polyunsaturated fat | 5.148g | 34% | |
| Iron | 0.4mg | 2.92mg | 32% |
| Protein | 11.7g | 24.62g | 26% |
| Vitamin B3 | 1.1mg | 5.245mg | 26% |
| Vitamin D | 193 IU | 24% | |
| Vitamin D | 4.8µg | 24% | |
| Copper | 0.186mg | 21% | |
| Vitamin E | 2.04mg | 14% | |
| Choline | 75mg | 14% | |
| Sodium | 307mg | 13% | |
| Vitamin B5 | 0.642mg | 13% | |
| Vitamin B6 | 0.167mg | 13% | |
| Potassium | 397mg | 12% | |
| Zinc | 1.31mg | 12% | |
| Vitamin B2 | 0.1mg | 0.227mg | 10% |
| Monounsaturated fat | 3.869g | 10% | |
| Fats | 5.3g | 11.45g | 9% |
| Magnesium | 39mg | 9% | |
| Saturated fat | 1.528g | 7% | |
| Calories | 97kcal | 208kcal | 6% |
| Manganese | 0.108mg | 5% | |
| Vitamin A | 32µg | 4% | |
| Vitamin C | 3mg | 0mg | 3% |
| Folate | 10µg | 3% | |
| Vitamin K | 2.6µg | 2% | |
| Vitamin B1 | 0.09mg | 0.08mg | 1% |
| Tryptophan | 0.276mg | 0% | |
| Threonine | 1.079mg | 0% | |
| Isoleucine | 1.134mg | 0% | |
| Leucine | 2.001mg | 0% | |
| Lysine | 2.26mg | 0% | |
| Methionine | 0.729mg | 0% | |
| Phenylalanine | 0.961mg | 0% | |
| Valine | 1.268mg | 0% | |
| Histidine | 0.725mg | 0% | |
| Omega-3 - EPA | 0.473g | N/A | |
| Omega-3 - DHA | 0.509g | N/A |
Macronutrient Comparison
Macronutrient breakdown side-by-side comparison
| Contains more WaterWater | +35.5% |
| Contains more ProteinProtein | +110.4% |
| Contains more FatsFats | +116% |
| Contains more OtherOther | +96.4% |
~equal in
Carbs
~0g


