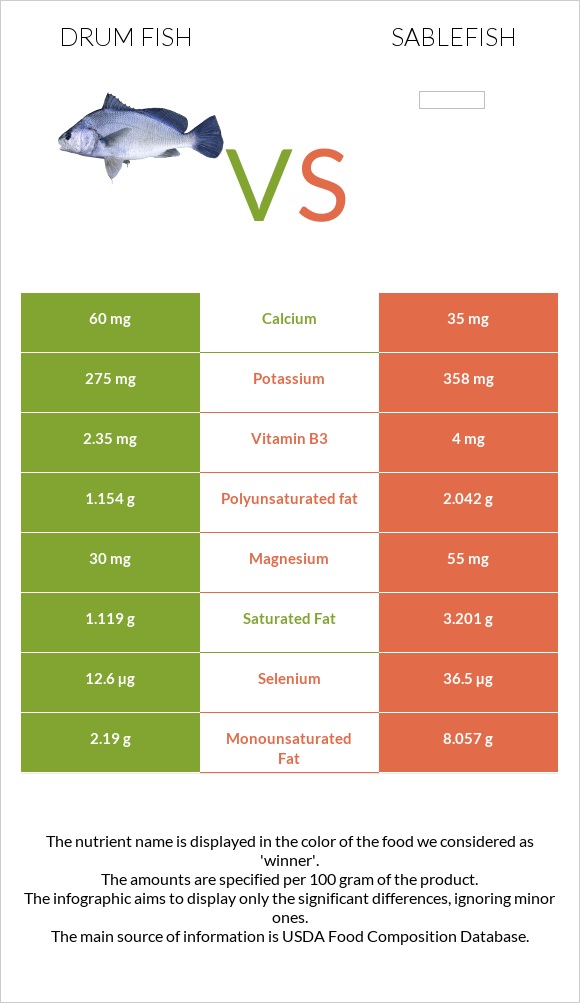
Summary of differences between drum fish and sablefish Drum fish has more manganese, vitamin B12, copper, and vitamin B2; however, sablefish is higher in selenium, vitamin B3, magnesium, and iron. Sablefish covers your daily need for selenium, 56% more than drum fish. Drum fish has 47 times more manganese than sablefish. While drum fish has 0.897mg of manganese, sablefish has only 0.019mg. Sablefish has less cholesterol. These are the specific foods used in this comparison Fish, drum, freshwater, cooked, dry heat and Fish, sablefish, cooked, dry heat .
Infographic
Mineral Comparison
Mineral comparison score is based on the number of minerals by which one or the other food is richer. The "coverage" charts below show how much of the daily needs can be covered by 300 grams of the food.
4
100 g
300 g
3 oz - 85g 1 fillet - 154g
Magnesium
Magnesium
Calcium
Calcium
Potassium
Potassium
Iron
Iron
Copper
Copper
Zinc
Zinc
Phosphorus
Phosphorus
Sodium
Sodium
Manganese
Manganese
Selenium
Selenium
27%
23%
31%
43%
99%
23%
99%
13%
117%
88%
5
100 g
300 g
3 oz - 85g 0.5 fillet - 151g
Magnesium
Magnesium
Calcium
Calcium
Potassium
Potassium
Iron
Iron
Copper
Copper
Zinc
Zinc
Phosphorus
Phosphorus
Sodium
Sodium
Manganese
Manganese
Selenium
Selenium
51%
14%
41%
62%
9.3%
11%
92%
9.4%
2.5%
255%
Vitamin Comparison
Vitamin comparison score is based on the number of vitamins by which one or the other food is richer. The "coverage" charts below show how much of the daily needs can be covered by 300 grams of the food.
3
100 g
300 g
3 oz - 85g 1 fillet - 154g
Vitamin C
Vit. C
Vitamin D
Vit. D
Vitamin A
Vit. A
Vitamin E
Vit. E
Vitamin B1
Vit. B1
Vitamin B2
Vit. B2
Vitamin B3
Vit. B3
Vitamin B5
Vit. B5
Vitamin B6
Vit. B6
Vitamin B12
Vit. B12
Vitamin K
Vit. K
Folate
Folate
3.3%
0%
20%
0%
20%
48%
54%
52%
80%
289%
0%
13%
3
100 g
300 g
3 oz - 85g 0.5 fillet - 151g
Vitamin C
Vit. C
Vitamin D
Vit. D
Vitamin A
Vit. A
Vitamin E
Vit. E
Vitamin B1
Vit. B1
Vitamin B2
Vit. B2
Vitamin B3
Vit. B3
Vitamin B5
Vit. B5
Vitamin B6
Vit. B6
Vitamin B12
Vit. B12
Vitamin K
Vit. K
Folate
Folate
0%
0%
34%
0%
31%
27%
96%
52%
80%
180%
0%
13%
All nutrients comparison - raw data values
Nutrient
DV% diff.
Selenium
16.2µg
46.8µg
56%
Manganese
0.897mg
0.019mg
38%
Vitamin B12
2.31µg
1.44µg
36%
Copper
0.297mg
0.028mg
30%
Fats
6.32g
19.62g
20%
Monounsaturated fat
2.807g
10.328g
19%
Vitamin B3
2.862mg
5.128mg
14%
Saturated fat
1.434g
4.099g
12%
Protein
22.49g
17.19g
11%
Magnesium
38mg
71mg
8%
Polyunsaturated fat
1.479g
2.618g
8%
Vitamin B2
0.207mg
0.115mg
7%
Cholesterol
82mg
63mg
6%
Iron
1.15mg
1.64mg
6%
Calories
153kcal
250kcal
5%
Vitamin A
59µg
102µg
5%
Zinc
0.85mg
0.41mg
4%
Calcium
77mg
45mg
3%
Potassium
353mg
459mg
3%
Vitamin B1
0.081mg
0.122mg
3%
Phosphorus
231mg
215mg
2%
Vitamin C
1mg
0mg
1%
Sodium
96mg
72mg
1%
Protein per 100 calories
15g
6.9g
N/A
Calories per 10 g protein
68kcal
145kcal
N/A
Weight per 100 calories
65g
40g
N/A
Unsaturated / Saturated Fat ratio
3
3.2
N/A
Vitamin B5
0.865mg
0.865mg
0%
Vitamin B6
0.346mg
0.346mg
0%
Folate
17µg
17µg
0%
Tryptophan
0.252mg
0.193mg
0%
Threonine
0.986mg
0.754mg
0%
Isoleucine
1.036mg
0.792mg
0%
Leucine
1.828mg
1.397mg
0%
Lysine
2.065mg
1.579mg
0%
Methionine
0.666mg
0.509mg
0%
Phenylalanine
0.878mg
0.671mg
0%
Valine
1.159mg
0.886mg
0%
Histidine
0.662mg
0.506mg
0%
Omega-3 - EPA
0.295g
0.867g
N/A
Omega-3 - DHA
0.368g
0.92g
N/A
Omega-3 - DPA
0.185g
0.216g
N/A
Macronutrient Comparison
Macronutrient breakdown side-by-side comparison
2
22%
6%
71%
Protein:
22.49 g
Fats:
6.32 g
Carbs:
0 g
Water:
70.94 g
Other:
0.25 g
2
17%
20%
63%
Protein:
17.19 g
Fats:
19.62 g
Carbs:
0 g
Water:
62.85 g
Other:
0.34 g
Contains
more
Protein Protein
+30.8%
Contains
more
Water Water
+12.9%
Contains
more
Fats Fats
+210.4%
Contains
more
Other Other
+36%
Fat Type Comparison
Fat type breakdown side-by-side comparison
1
25%
49%
26%
Saturated fat:
Sat. Fat
1.434 g
Monounsaturated fat:
Mono. Fat
2.807 g
Polyunsaturated fat:
Poly. Fat
1.479 g
2
24%
61%
15%
Saturated fat:
Sat. Fat
4.099 g
Monounsaturated fat:
Mono. Fat
10.328 g
Polyunsaturated fat:
Poly. Fat
2.618 g
Contains
less
Sat. Fat Saturated fat
-65%
Contains
more
Mono. Fat Monounsaturated fat
+267.9%
Contains
more
Poly. Fat Polyunsaturated fat
+77%