The main differences between eggs and peas Eggs are richer in copper, selenium, choline, vitamin B12, and vitamin B2, yet peas are richer in vitamin B5, fiber, manganese, and vitamin K. Daily need coverage for vitamin B5 for peas is 3032% higher. Eggs have a lower glycemic index than peas. Food types used in this article are Egg, whole, cooked, hard-boiled and Peas, green, cooked, boiled, drained, without salt .
Infographic
Mineral Comparison
Mineral comparison score is based on the number of minerals by which one or the other food is richer. The "coverage" charts below show how much of the daily needs can be covered by 300 grams of the food.
4
100 g
300 g
1 tbsp - 8.5g 1 large - 50g 1 cup, chopped - 136g
Magnesium
Magnesium
Calcium
Calcium
Potassium
Potassium
Iron
Iron
Copper
Copper
Zinc
Zinc
Phosphorus
Phosphorus
Sodium
Sodium
Manganese
Manganese
Selenium
Selenium
7.1%
15%
11%
45%
667%
29%
74%
16%
3.4%
168%
6
100 g
300 g
1 cup - 160g
Magnesium
Magnesium
Calcium
Calcium
Potassium
Potassium
Iron
Iron
Copper
Copper
Zinc
Zinc
Phosphorus
Phosphorus
Sodium
Sodium
Manganese
Manganese
Selenium
Selenium
28%
8.1%
24%
58%
58%
32%
50%
0.39%
68%
10%
Vitamin Comparison
Vitamin comparison score is based on the number of vitamins by which one or the other food is richer. The "coverage" charts below show how much of the daily needs can be covered by 300 grams of the food.
5
100 g
300 g
1 tbsp - 8.5g 1 large - 50g 1 cup, chopped - 136g
Vitamin C
Vit. C
Vitamin D
Vit. D
Vitamin A
Vit. A
Vitamin E
Vit. E
Vitamin B1
Vit. B1
Vitamin B2
Vit. B2
Vitamin B3
Vit. B3
Vitamin B5
Vit. B5
Vitamin B6
Vit. B6
Vitamin B12
Vit. B12
Vitamin K
Vit. K
Folate
Folate
0%
33%
50%
21%
17%
118%
1.2%
84%
28%
139%
0.75%
33%
7
100 g
300 g
1 cup - 160g
Vitamin C
Vit. C
Vitamin D
Vit. D
Vitamin A
Vit. A
Vitamin E
Vit. E
Vitamin B1
Vit. B1
Vitamin B2
Vit. B2
Vitamin B3
Vit. B3
Vitamin B5
Vit. B5
Vitamin B6
Vit. B6
Vitamin B12
Vit. B12
Vitamin K
Vit. K
Folate
Folate
47%
0%
13%
2.8%
65%
34%
38%
9180%
50%
0%
65%
47%
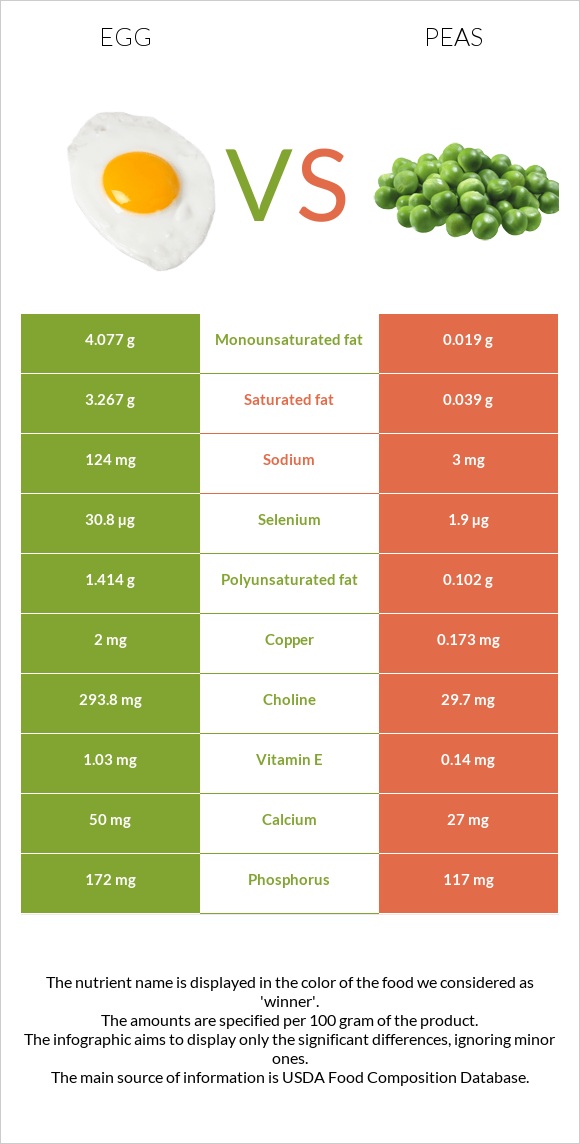
All nutrients comparison - raw data values
Nutrient
DV% diff.
Vitamin B5
1.398mg
153mg
3032%
Copper
2mg
0.173mg
203%
Cholesterol
373mg
0mg
124%
Selenium
30.8µg
1.9µg
53%
Choline
293.8mg
29.7mg
48%
Vitamin B12
1.11µg
0µg
46%
Vitamin B2
0.513mg
0.149mg
28%
Fiber
0g
5.5g
22%
Manganese
0.026mg
0.525mg
22%
Vitamin K
0.3µg
25.9µg
21%
Fats
10.61g
0.22g
16%
Vitamin C
0mg
14.2mg
16%
Vitamin B1
0.066mg
0.259mg
16%
Saturated fat
3.267g
0.039g
15%
Protein
12.58g
5.36g
14%
Vitamin A
149µg
40µg
12%
Vitamin B3
0.064mg
2.021mg
12%
Vitamin D*
87 IU
0 IU
11%
Vitamin D
2.2µg
0µg
11%
Monounsaturated fat
4.077g
0.019g
10%
Polyunsaturated fat
1.414g
0.102g
9%
Phosphorus
172mg
117mg
8%
Magnesium
10mg
39mg
7%
Vitamin B6
0.121mg
0.216mg
7%
Vitamin E
1.03mg
0.14mg
6%
Carbs
1.12g
15.63g
5%
Sodium
124mg
3mg
5%
Folate
44µg
63µg
5%
Calories
155kcal
84kcal
4%
Potassium
126mg
271mg
4%
Iron
1.19mg
1.54mg
4%
Calcium
50mg
27mg
2%
Zinc
1.05mg
1.19mg
1%
Fructose
0.41g
1%
Protein per 100 calories
8.1g
6.4g
N/A
Calories per 10 g protein
123kcal
157kcal
N/A
Weight per 100 calories
65g
119g
N/A
Unsaturated / Saturated Fat ratio
1.7
3.1
N/A
Net carbs
1.12g
10.13g
N/A
Sugar
1.12g
5.93g
N/A
Tryptophan
0.153mg
0.037mg
0%
Threonine
0.604mg
0.201mg
0%
Isoleucine
0.686mg
0.193mg
0%
Leucine
1.075mg
0.32mg
0%
Lysine
0.904mg
0.314mg
0%
Methionine
0.392mg
0.081mg
0%
Phenylalanine
0.668mg
0.198mg
0%
Valine
0.767mg
0.232mg
0%
Histidine
0.298mg
0.105mg
0%
Omega-3 - EPA
0.005g
0g
N/A
Omega-3 - DHA
0.038g
0g
N/A
Macronutrient Comparison
Macronutrient breakdown side-by-side comparison
3
13%
11%
75%
Protein:
12.58 g
Fats:
10.61 g
Carbs:
1.12 g
Water:
74.62 g
Other:
1.07 g
2
5%
16%
78%
Protein:
5.36 g
Fats:
0.22 g
Carbs:
15.63 g
Water:
77.87 g
Other:
0.92 g
Contains
more
Protein Protein
+134.7%
Contains
more
Fats Fats
+4722.7%
Contains
more
Other Other
+16.3%
Contains
more
Carbs Carbs
+1295.5%
Fat Type Comparison
Fat type breakdown side-by-side comparison
2
37%
47%
16%
Saturated fat:
Sat. Fat
3.267 g
Monounsaturated fat:
Mono. Fat
4.077 g
Polyunsaturated fat:
Poly. Fat
1.414 g
1
24%
12%
64%
Saturated fat:
Sat. Fat
0.039 g
Monounsaturated fat:
Mono. Fat
0.019 g
Polyunsaturated fat:
Poly. Fat
0.102 g
Contains
more
Mono. Fat Monounsaturated fat
+21357.9%
Contains
more
Poly. Fat Polyunsaturated fat
+1286.3%
Contains
less
Sat. Fat Saturated fat
-98.8%