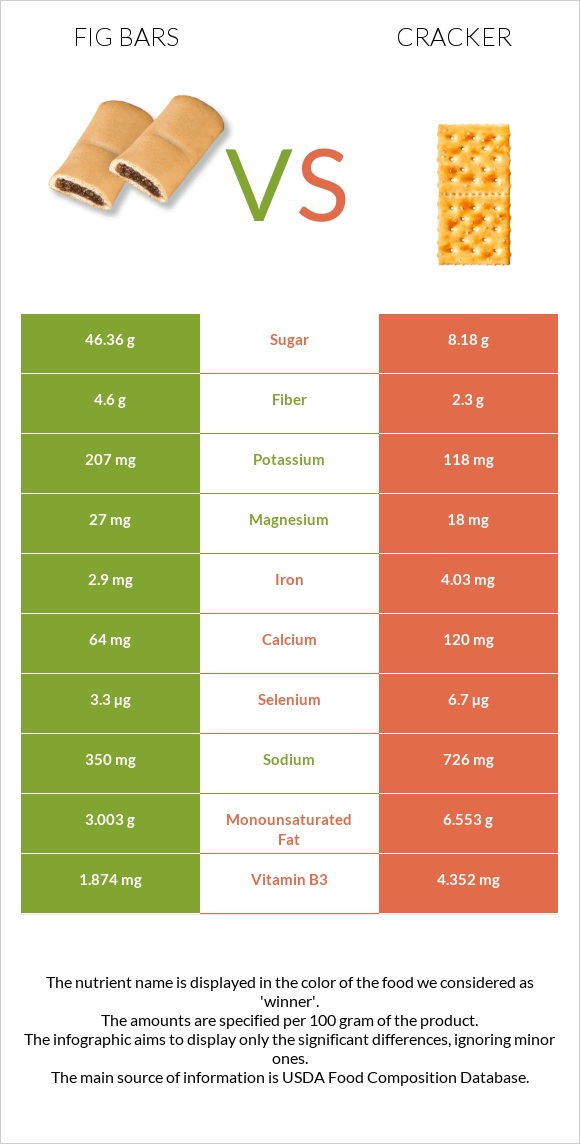
How are fig bars and crackers different? Crackers have more vitamin K, phosphorus, vitamin B1, vitamin B2, vitamin E, vitamin B3, folate, and iron than fig bars. Daily need coverage for vitamin K for crackers is 53% higher. Fig bars have less sodium. Cookies, fig bars and Crackers, standard snack-type, regular are the varieties used in this article.
Infographic
Mineral Comparison
Mineral comparison score is based on the number of minerals by which one or the other food is richer. The "coverage" charts below show how much of the daily needs can be covered by 300 grams of the food.
4
100 g
300 g
1 cookie - 16g 1 oz - 28.35g 1 Figaroo (2 square halves) - 43g 1 individual package (2 oz package containing 2 3" bars) - 57g
Magnesium
Magnesium
Calcium
Calcium
Potassium
Potassium
Iron
Iron
Copper
Copper
Zinc
Zinc
Phosphorus
Phosphorus
Sodium
Sodium
Manganese
Manganese
Selenium
Selenium
19%
19%
18%
109%
49%
11%
27%
46%
45%
18%
6
100 g
300 g
1 cracker, round - 3.2g 1 cracker, rectangular - 4g 5 crackers - 16g 5 crackers, regular size, round (1 serving) - 16g 1 cup crushed - 52g
Magnesium
Magnesium
Calcium
Calcium
Potassium
Potassium
Iron
Iron
Copper
Copper
Zinc
Zinc
Phosphorus
Phosphorus
Sodium
Sodium
Manganese
Manganese
Selenium
Selenium
13%
36%
10%
151%
35%
13%
106%
95%
64%
37%
Vitamin Comparison
Vitamin comparison score is based on the number of vitamins by which one or the other food is richer. The "coverage" charts below show how much of the daily needs can be covered by 300 grams of the food.
4
100 g
300 g
1 cookie - 16g 1 oz - 28.35g 1 Figaroo (2 square halves) - 43g 1 individual package (2 oz package containing 2 3" bars) - 57g
Vitamin C
Vit. C
Vitamin D
Vit. D
Vitamin A
Vit. A
Vitamin E
Vit. E
Vitamin B1
Vit. B1
Vitamin B2
Vit. B2
Vitamin B3
Vit. B3
Vitamin B5
Vit. B5
Vitamin B6
Vit. B6
Vitamin B12
Vit. B12
Vitamin K
Vit. K
Folate
Folate
1%
0%
3%
13%
40%
50%
35%
22%
17%
11%
15%
26%
7
100 g
300 g
1 cracker, round - 3.2g 1 cracker, rectangular - 4g 5 crackers - 16g 5 crackers, regular size, round (1 serving) - 16g 1 cup crushed - 52g
Vitamin C
Vit. C
Vitamin D
Vit. D
Vitamin A
Vit. A
Vitamin E
Vit. E
Vitamin B1
Vit. B1
Vitamin B2
Vit. B2
Vitamin B3
Vit. B3
Vitamin B5
Vit. B5
Vitamin B6
Vit. B6
Vitamin B12
Vit. B12
Vitamin K
Vit. K
Folate
Folate
0%
0%
0%
61%
104%
105%
82%
25%
15%
0%
173%
69%
All nutrients comparison - raw data values
Nutrient
DV% diff.
Polyunsaturated fat
2.772g
13.137g
69%
Vitamin K
5.8µg
69.3µg
53%
Fats
7.3g
26.43g
29%
Phosphorus
62mg
248mg
27%
Vitamin B1
0.158mg
0.416mg
22%
Starch
49.69g
20%
Saturated fat
1.123g
5.562g
20%
Vitamin B2
0.217mg
0.456mg
18%
Sodium
350mg
726mg
16%
Vitamin E
0.65mg
3.03mg
16%
Vitamin B3
1.874mg
4.352mg
15%
Iron
2.9mg
4.03mg
14%
Folate
35µg
92µg
14%
Fiber
4.6g
2.3g
9%
Monounsaturated fat
3.003g
6.553g
9%
Calories
348kcal
510kcal
8%
Protein
3.7g
6.64g
6%
Calcium
64mg
120mg
6%
Manganese
0.343mg
0.491mg
6%
Selenium
3.3µg
6.7µg
6%
Copper
0.147mg
0.104mg
5%
Vitamin B12
0.09µg
0µg
4%
Carbs
70.9g
61.3g
3%
Potassium
207mg
118mg
3%
Magnesium
27mg
18mg
2%
Zinc
0.39mg
0.49mg
1%
Vitamin A
9µg
0µg
1%
Vitamin B5
0.364mg
0.417mg
1%
Vitamin B6
0.075mg
0.063mg
1%
Choline
14.6mg
9.6mg
1%
Protein per 100 calories
1.1g
1.3g
N/A
Calories per 10 g protein
941kcal
768kcal
N/A
Weight per 100 calories
29g
20g
N/A
Unsaturated / Saturated Fat ratio
5.1
3.5
N/A
Vitamin C
0.3mg
0mg
0%
Net carbs
66.3g
59g
N/A
Sugar
46.36g
8.18g
N/A
Trans fat
1.076g
N/A
Tryptophan
0.046mg
0.084mg
0%
Threonine
0.113mg
0.193mg
0%
Isoleucine
0.132mg
0.246mg
0%
Leucine
0.224mg
0.471mg
0%
Lysine
0.14mg
0.103mg
0%
Methionine
0.053mg
0.112mg
0%
Phenylalanine
0.145mg
0.331mg
0%
Valine
0.155mg
0.294mg
0%
Histidine
0.067mg
0.145mg
0%
Fructose
0.29g
0%
Omega-3 - ALA
1.485g
N/A
Omega-6 - Gamma-linoleic acid
0.062g
N/A
Omega-6 - Eicosadienoic acid
0.009g
N/A
Omega-6 - Linoleic acid
11.48g
N/A
Macronutrient Comparison
Macronutrient breakdown side-by-side comparison
2
4%
7%
71%
17%
Protein:
3.7 g
Fats:
7.3 g
Carbs:
70.9 g
Water:
16.5 g
Other:
1.6 g
3
7%
26%
61%
3%
2%
Protein:
6.64 g
Fats:
26.43 g
Carbs:
61.3 g
Water:
3.14 g
Other:
2.49 g
Contains
more
Carbs Carbs
+15.7%
Contains
more
Water Water
+425.5%
Contains
more
Protein Protein
+79.5%
Contains
more
Fats Fats
+262.1%
Contains
more
Other Other
+55.6%
Fat Type Comparison
Fat type breakdown side-by-side comparison
1
16%
44%
40%
Saturated fat:
Sat. Fat
1.123 g
Monounsaturated fat:
Mono. Fat
3.003 g
Polyunsaturated fat:
Poly. Fat
2.772 g
2
22%
26%
52%
Saturated fat:
Sat. Fat
5.562 g
Monounsaturated fat:
Mono. Fat
6.553 g
Polyunsaturated fat:
Poly. Fat
13.137 g
Contains
less
Sat. Fat Saturated fat
-79.8%
Contains
more
Mono. Fat Monounsaturated fat
+118.2%
Contains
more
Poly. Fat Polyunsaturated fat
+373.9%