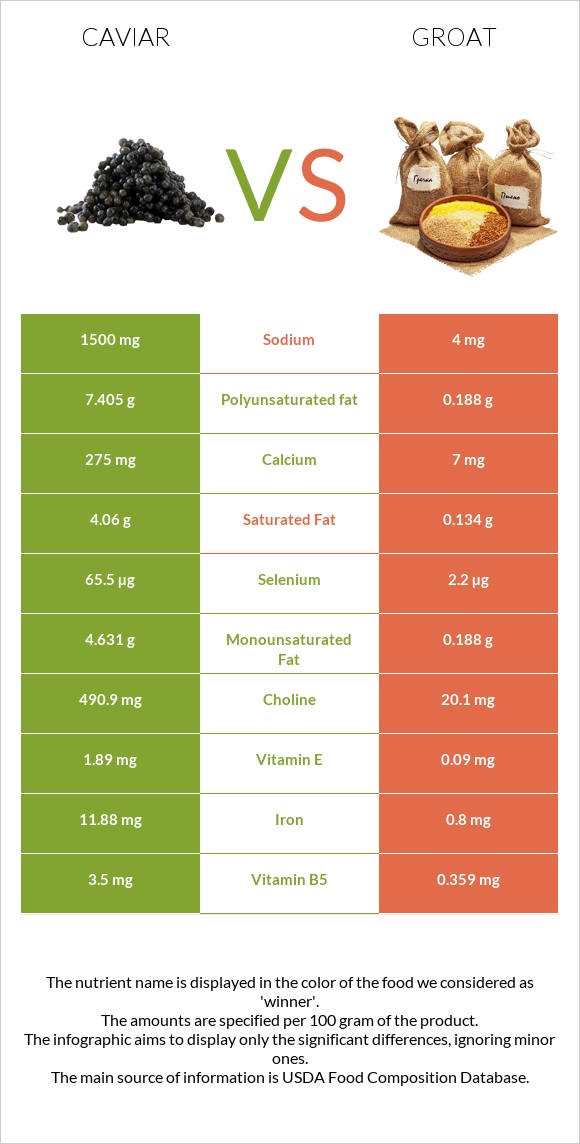
Significant differences between caviar and groat Caviar has more vitamin B12, iron, selenium, and vitamin B5; however, groat is richer in copper, manganese, vitamin B3, and fiber. Caviar covers your daily vitamin B12 needs 833% more than groat. Groat has a higher glycemic index. The glycemic index of groat is 54, while the glycemic index of caviar is 0. Specific food types used in this comparison are Fish, caviar, black, and red, granular and Buckwheat .
Infographic
Mineral Comparison
Mineral comparison score is based on the number of minerals by which one or the other food is richer. The "coverage" charts below show how much of the daily needs can be covered by 300 grams of the food.
4
100 g
300 g
1 tbsp - 16g 1 oz - 28.35g
Magnesium
Magnesium
Calcium
Calcium
Potassium
Potassium
Iron
Iron
Copper
Copper
Zinc
Zinc
Phosphorus
Phosphorus
Sodium
Sodium
Manganese
Manganese
Selenium
Selenium
214%
83%
16%
446%
37%
26%
153%
196%
6.5%
357%
5
100 g
300 g
1 cup - 170g
Magnesium
Magnesium
Calcium
Calcium
Potassium
Potassium
Iron
Iron
Copper
Copper
Zinc
Zinc
Phosphorus
Phosphorus
Sodium
Sodium
Manganese
Manganese
Selenium
Selenium
165%
5.4%
41%
83%
367%
65%
149%
0.13%
170%
45%
Vitamin Comparison
Vitamin comparison score is based on the number of vitamins by which one or the other food is richer. The "coverage" charts below show how much of the daily needs can be covered by 300 grams of the food.
10
100 g
300 g
1 tbsp - 16g 1 oz - 28.35g
Vitamin C
Vit. C
Vitamin D
Vit. D
Vitamin A
Vit. A
Vitamin E
Vit. E
Vitamin B1
Vit. B1
Vitamin B2
Vit. B2
Vitamin B3
Vit. B3
Vitamin B5
Vit. B5
Vitamin B6
Vit. B6
Vitamin B12
Vit. B12
Vitamin K
Vit. K
Folate
Folate
0%
44%
90%
38%
48%
143%
2.3%
210%
74%
2500%
1.5%
38%
1
100 g
300 g
1 cup - 170g
Vitamin C
Vit. C
Vitamin D
Vit. D
Vitamin A
Vit. A
Vitamin E
Vit. E
Vitamin B1
Vit. B1
Vitamin B2
Vit. B2
Vitamin B3
Vit. B3
Vitamin B5
Vit. B5
Vitamin B6
Vit. B6
Vitamin B12
Vit. B12
Vitamin K
Vit. K
Folate
Folate
0%
0%
0%
0%
25%
98%
132%
74%
48%
0%
0%
23%
All nutrients comparison - raw data values
Nutrient
DV% diff.
Vitamin B12
20µg
0µg
833%
Cholesterol
588mg
0mg
196%
Iron
11.88mg
2.2mg
121%
Copper
0.11mg
1.1mg
110%
Selenium
65.5µg
8.3µg
104%
Choline
490.9mg
89%
Sodium
1500mg
1mg
65%
Manganese
0.05mg
1.3mg
54%
Vitamin B5
3.5mg
1.233mg
45%
Vitamin B3
0.12mg
7.02mg
43%
Polyunsaturated fat
7.405g
1.039g
42%
Fiber
0g
10g
40%
Vitamin A
271µg
0µg
30%
Calcium
275mg
18mg
26%
Protein
24.6g
13.25g
23%
Carbs
4g
71.5g
23%
Fats
17.9g
3.4g
22%
Magnesium
300mg
231mg
16%
Vitamin D*
117 IU
0 IU
15%
Vitamin D
2.9µg
0µg
15%
Vitamin B2
0.62mg
0.425mg
15%
Saturated fat
4.06g
0.741g
15%
Zinc
0.95mg
2.4mg
13%
Vitamin E
1.89mg
13%
Monounsaturated fat
4.631g
1.04g
9%
Potassium
181mg
460mg
8%
Vitamin B6
0.32mg
0.21mg
8%
Vitamin B1
0.19mg
0.101mg
7%
Folate
50µg
30µg
5%
Calories
264kcal
343kcal
4%
Phosphorus
356mg
347mg
1%
Vitamin K
0.6µg
1%
Protein per 100 calories
9.3g
3.9g
N/A
Calories per 10 g protein
107kcal
259kcal
N/A
Weight per 100 calories
38g
29g
N/A
Unsaturated / Saturated Fat ratio
3
2.8
N/A
Net carbs
4g
61.5g
N/A
Tryptophan
0.323mg
0.192mg
0%
Threonine
1.263mg
0.506mg
0%
Isoleucine
1.035mg
0.498mg
0%
Leucine
2.133mg
0.832mg
0%
Lysine
1.834mg
0.672mg
0%
Methionine
0.646mg
0.172mg
0%
Phenylalanine
1.071mg
0.52mg
0%
Valine
1.263mg
0.678mg
0%
Histidine
0.649mg
0.309mg
0%
Omega-3 - EPA
2.741g
0g
N/A
Omega-3 - DHA
3.8g
0g
N/A
Omega-3 - DPA
0.229g
0g
N/A
Macronutrient Comparison
Macronutrient breakdown side-by-side comparison
4
25%
18%
4%
48%
6%
Protein:
24.6 g
Fats:
17.9 g
Carbs:
4 g
Water:
47.5 g
Other:
6 g
1
13%
3%
72%
10%
2%
Protein:
13.25 g
Fats:
3.4 g
Carbs:
71.5 g
Water:
9.75 g
Other:
2.1 g
Contains
more
Protein Protein
+85.7%
Contains
more
Fats Fats
+426.5%
Contains
more
Water Water
+387.2%
Contains
more
Other Other
+185.7%
Contains
more
Carbs Carbs
+1687.5%
Fat Type Comparison
Fat type breakdown side-by-side comparison
2
25%
29%
46%
Saturated fat:
Sat. Fat
4.06 g
Monounsaturated fat:
Mono. Fat
4.631 g
Polyunsaturated fat:
Poly. Fat
7.405 g
1
26%
37%
37%
Saturated fat:
Sat. Fat
0.741 g
Monounsaturated fat:
Mono. Fat
1.04 g
Polyunsaturated fat:
Poly. Fat
1.039 g
Contains
more
Mono. Fat Monounsaturated fat
+345.3%
Contains
more
Poly. Fat Polyunsaturated fat
+612.7%
Contains
less
Sat. Fat Saturated fat
-81.7%