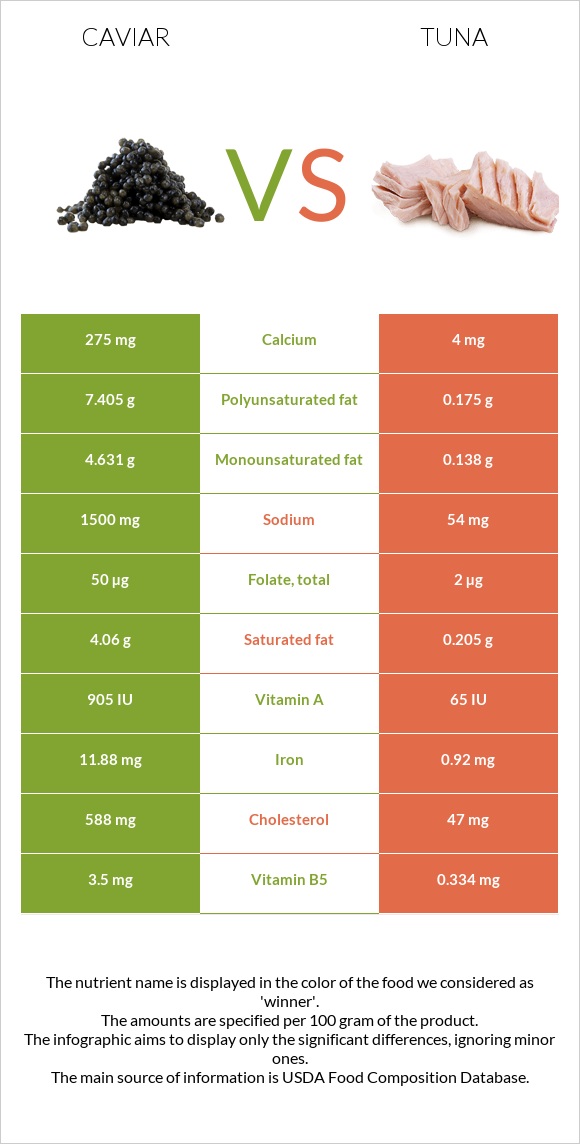
Summary of differences between caviar and tuna Caviar has more vitamin B12, iron, choline, vitamin B5, and magnesium, while tuna has more vitamin B3, selenium, and vitamin B6. Caviar covers your daily need for vitamin B12, 735% more than tuna. Caviar contains 28 times more sodium than tuna. While caviar contains 1500mg of sodium, tuna contains only 54mg. These are the specific foods used in this comparison Fish, caviar, black, and red, granular and Fish, tuna, yellowfin, fresh, cooked, dry heat .
Infographic
Mineral Comparison
Mineral comparison score is based on the number of minerals by which one or the other food is richer. The "coverage" charts below show how much of the daily needs can be covered by 300 grams of the food.
6
100 g
300 g
1 tbsp - 16g 1 oz - 28.35g
Magnesium
Magnesium
Calcium
Calcium
Potassium
Potassium
Iron
Iron
Copper
Copper
Zinc
Zinc
Phosphorus
Phosphorus
Sodium
Sodium
Manganese
Manganese
Selenium
Selenium
214%
83%
16%
446%
37%
26%
153%
196%
6.5%
357%
3
100 g
300 g
3 oz - 85g
Magnesium
Magnesium
Calcium
Calcium
Potassium
Potassium
Iron
Iron
Copper
Copper
Zinc
Zinc
Phosphorus
Phosphorus
Sodium
Sodium
Manganese
Manganese
Selenium
Selenium
30%
1.2%
47%
35%
14%
12%
143%
7%
1.7%
590%
Vitamin Comparison
Vitamin comparison score is based on the number of vitamins by which one or the other food is richer. The "coverage" charts below show how much of the daily needs can be covered by 300 grams of the food.
9
100 g
300 g
1 tbsp - 16g 1 oz - 28.35g
Vitamin C
Vit. C
Vitamin D
Vit. D
Vitamin A
Vit. A
Vitamin E
Vit. E
Vitamin B1
Vit. B1
Vitamin B2
Vit. B2
Vitamin B3
Vit. B3
Vitamin B5
Vit. B5
Vitamin B6
Vit. B6
Vitamin B12
Vit. B12
Vitamin K
Vit. K
Folate
Folate
0%
44%
90%
38%
48%
143%
2.3%
210%
74%
2500%
1.5%
38%
2
100 g
300 g
3 oz - 85g
Vitamin C
Vit. C
Vitamin D
Vit. D
Vitamin A
Vit. A
Vitamin E
Vit. E
Vitamin B1
Vit. B1
Vitamin B2
Vit. B2
Vitamin B3
Vit. B3
Vitamin B5
Vit. B5
Vitamin B6
Vit. B6
Vitamin B12
Vit. B12
Vitamin K
Vit. K
Folate
Folate
0%
30%
7.3%
5.8%
34%
32%
414%
20%
240%
294%
0.25%
1.5%
All nutrients comparison - raw data values
Nutrient
DV% diff.
Vitamin B12
20µg
2.35µg
735%
Cholesterol
588mg
47mg
180%
Iron
11.88mg
0.92mg
137%
Vitamin B3
0.12mg
22.07mg
137%
Selenium
65.5µg
108.2µg
78%
Choline
490.9mg
77.6mg
75%
Sodium
1500mg
54mg
63%
Vitamin B5
3.5mg
0.334mg
63%
Magnesium
300mg
42mg
61%
Vitamin B6
0.32mg
1.038mg
55%
Polyunsaturated fat
7.405g
0.175g
48%
Vitamin B2
0.62mg
0.137mg
37%
Vitamin A
271µg
22µg
28%
Fats
17.9g
0.59g
27%
Calcium
275mg
4mg
27%
Saturated fat
4.06g
0.205g
18%
Folate
50µg
2µg
12%
Vitamin E
1.89mg
0.29mg
11%
Monounsaturated fat
4.631g
0.138g
11%
Potassium
181mg
527mg
10%
Protein
24.6g
29.15g
9%
Calories
264kcal
130kcal
7%
Copper
0.11mg
0.043mg
7%
Vitamin D
2.9µg
2µg
5%
Zinc
0.95mg
0.45mg
5%
Vitamin B1
0.19mg
0.134mg
5%
Vitamin D*
117 IU
82 IU
4%
Phosphorus
356mg
333mg
3%
Manganese
0.05mg
0.013mg
2%
Carbs
4g
0g
1%
Protein per 100 calories
9.3g
22g
N/A
Calories per 10 g protein
107kcal
45kcal
N/A
Weight per 100 calories
38g
77g
N/A
Unsaturated / Saturated Fat ratio
3
1.5
N/A
Net carbs
4g
0g
N/A
Vitamin K
0.6µg
0.1µg
0%
Trans fat
0.02g
N/A
Tryptophan
0.323mg
0.313mg
0%
Threonine
1.263mg
1.224mg
0%
Isoleucine
1.035mg
1.287mg
0%
Leucine
2.133mg
2.27mg
0%
Lysine
1.834mg
2.565mg
0%
Methionine
0.646mg
0.827mg
0%
Phenylalanine
1.071mg
1.091mg
0%
Valine
1.263mg
1.438mg
0%
Histidine
0.649mg
0.822mg
0%
Omega-3 - EPA
2.741g
0.015g
N/A
Omega-3 - DHA
3.8g
0.105g
N/A
Omega-3 - DPA
0.229g
0.005g
N/A
Omega-6 - Eicosadienoic acid
0.002g
N/A
Macronutrient Comparison
Macronutrient breakdown side-by-side comparison
3
25%
18%
4%
48%
6%
Protein:
24.6 g
Fats:
17.9 g
Carbs:
4 g
Water:
47.5 g
Other:
6 g
2
29%
69%
Protein:
29.15 g
Fats:
0.59 g
Carbs:
0 g
Water:
68.98 g
Other:
1.28 g
Contains
more
Fats Fats
+2933.9%
Contains
more
Carbs Carbs
+∞%
Contains
more
Other Other
+368.8%
Contains
more
Protein Protein
+18.5%
Contains
more
Water Water
+45.2%
Fat Type Comparison
Fat type breakdown side-by-side comparison
2
25%
29%
46%
Saturated fat:
Sat. Fat
4.06 g
Monounsaturated fat:
Mono. Fat
4.631 g
Polyunsaturated fat:
Poly. Fat
7.405 g
1
40%
27%
34%
Saturated fat:
Sat. Fat
0.205 g
Monounsaturated fat:
Mono. Fat
0.138 g
Polyunsaturated fat:
Poly. Fat
0.175 g
Contains
more
Mono. Fat Monounsaturated fat
+3255.8%
Contains
more
Poly. Fat Polyunsaturated fat
+4131.4%
Contains
less
Sat. Fat Saturated fat
-95%