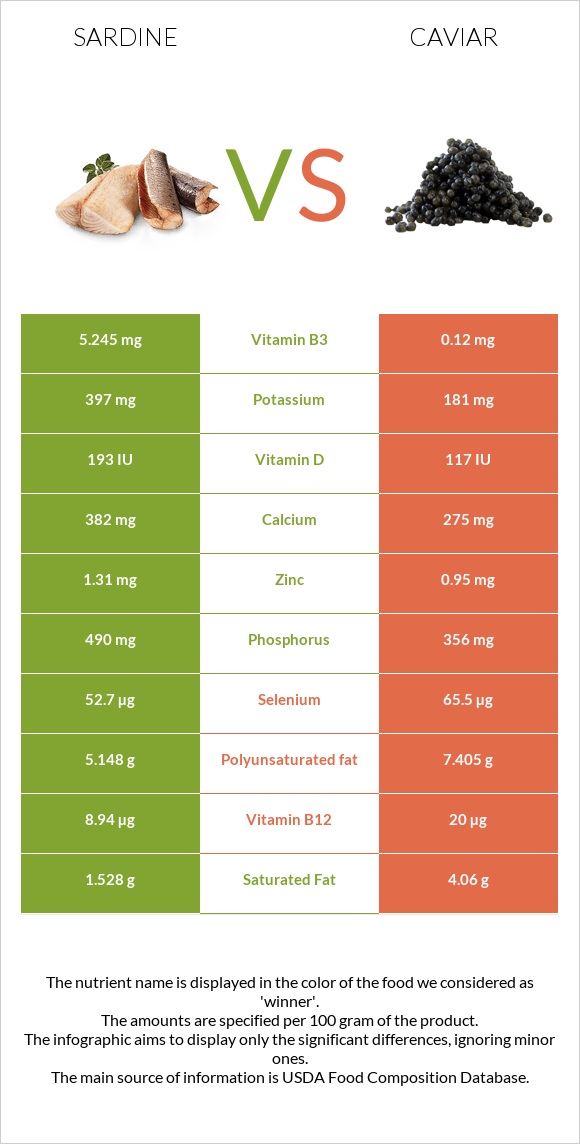
Significant differences between sardines and caviar Sardines have more vitamin B3; however, caviar is richer in vitamin B12, iron, choline, magnesium, vitamin B5, vitamin B2, and selenium. Caviar covers your daily vitamin B12 needs 461% more than sardines. Caviar has 44 times less vitamin B3 than sardines. Sardines have 5.245mg of vitamin B3, while caviar has 0.12mg. Sardines contain less cholesterol. Specific food types used in this comparison are Fish, sardine, Atlantic, canned in oil, drained solids with bone and Fish, caviar, black, and red, granular .
Infographic
Mineral Comparison
Mineral comparison score is based on the number of minerals by which one or the other food is richer. The "coverage" charts below show how much of the daily needs can be covered by 300 grams of the food.
7
100 g
300 g
1 small (2-2/3" x 1/2" x 1/4") - 12g 1 cubic inch - 16g 2 sardines - 24g 1 oz - 28.35g 1 can (3.75 oz) - 92g 1 cup, drained - 149g
Magnesium
Magnesium
Calcium
Calcium
Potassium
Potassium
Iron
Iron
Copper
Copper
Zinc
Zinc
Phosphorus
Phosphorus
Sodium
Sodium
Manganese
Manganese
Selenium
Selenium
28%
115%
35%
110%
62%
36%
210%
40%
14%
287%
3
100 g
300 g
1 tbsp - 16g 1 oz - 28.35g
Magnesium
Magnesium
Calcium
Calcium
Potassium
Potassium
Iron
Iron
Copper
Copper
Zinc
Zinc
Phosphorus
Phosphorus
Sodium
Sodium
Manganese
Manganese
Selenium
Selenium
214%
83%
16%
446%
37%
26%
153%
196%
6.5%
357%
Vitamin Comparison
Vitamin comparison score is based on the number of vitamins by which one or the other food is richer. The "coverage" charts below show how much of the daily needs can be covered by 300 grams of the food.
3
100 g
300 g
1 small (2-2/3" x 1/2" x 1/4") - 12g 1 cubic inch - 16g 2 sardines - 24g 1 oz - 28.35g 1 can (3.75 oz) - 92g 1 cup, drained - 149g
Vitamin C
Vit. C
Vitamin D
Vit. D
Vitamin A
Vit. A
Vitamin E
Vit. E
Vitamin B1
Vit. B1
Vitamin B2
Vit. B2
Vitamin B3
Vit. B3
Vitamin B5
Vit. B5
Vitamin B6
Vit. B6
Vitamin B12
Vit. B12
Vitamin K
Vit. K
Folate
Folate
0%
72%
11%
41%
20%
52%
98%
39%
39%
1118%
6.5%
7.5%
7
100 g
300 g
1 tbsp - 16g 1 oz - 28.35g
Vitamin C
Vit. C
Vitamin D
Vit. D
Vitamin A
Vit. A
Vitamin E
Vit. E
Vitamin B1
Vit. B1
Vitamin B2
Vit. B2
Vitamin B3
Vit. B3
Vitamin B5
Vit. B5
Vitamin B6
Vit. B6
Vitamin B12
Vit. B12
Vitamin K
Vit. K
Folate
Folate
0%
44%
90%
38%
48%
143%
2.3%
210%
74%
2500%
1.5%
38%
All nutrients comparison - raw data values
Nutrient
DV% diff.
Vitamin B12
8.94µg
20µg
461%
Cholesterol
142mg
588mg
149%
Iron
2.92mg
11.88mg
112%
Choline
75mg
490.9mg
76%
Magnesium
39mg
300mg
62%
Vitamin B5
0.642mg
3.5mg
57%
Sodium
307mg
1500mg
52%
Vitamin B3
5.245mg
0.12mg
32%
Vitamin B2
0.227mg
0.62mg
30%
Vitamin A
32µg
271µg
27%
Selenium
52.7µg
65.5µg
23%
Phosphorus
490mg
356mg
19%
Polyunsaturated fat
5.148g
7.405g
15%
Vitamin B6
0.167mg
0.32mg
12%
Saturated fat
1.528g
4.06g
12%
Calcium
382mg
275mg
11%
Fats
11.45g
17.9g
10%
Vitamin D*
193 IU
117 IU
10%
Vitamin D
4.8µg
2.9µg
10%
Folate
10µg
50µg
10%
Vitamin B1
0.08mg
0.19mg
9%
Copper
0.186mg
0.11mg
8%
Potassium
397mg
181mg
6%
Calories
208kcal
264kcal
3%
Zinc
1.31mg
0.95mg
3%
Manganese
0.108mg
0.05mg
3%
Vitamin K
2.6µg
0.6µg
2%
Monounsaturated fat
3.869g
4.631g
2%
Carbs
0g
4g
1%
Vitamin E
2.04mg
1.89mg
1%
Protein
24.62g
24.6g
0%
Protein per 100 calories
12g
9.3g
N/A
Calories per 10 g protein
84kcal
107kcal
N/A
Weight per 100 calories
48g
38g
N/A
Unsaturated / Saturated Fat ratio
5.9
3
N/A
Net carbs
0g
4g
N/A
Tryptophan
0.276mg
0.323mg
0%
Threonine
1.079mg
1.263mg
0%
Isoleucine
1.134mg
1.035mg
0%
Leucine
2.001mg
2.133mg
0%
Lysine
2.26mg
1.834mg
0%
Methionine
0.729mg
0.646mg
0%
Phenylalanine
0.961mg
1.071mg
0%
Valine
1.268mg
1.263mg
0%
Histidine
0.725mg
0.649mg
0%
Omega-3 - EPA
0.473g
2.741g
N/A
Omega-3 - DHA
0.509g
3.8g
N/A
Omega-3 - DPA
0g
0.229g
N/A
Macronutrient Comparison
Macronutrient breakdown side-by-side comparison
2
25%
11%
60%
4%
Protein:
24.62 g
Fats:
11.45 g
Carbs:
0 g
Water:
59.61 g
Other:
4.32 g
3
25%
18%
4%
48%
6%
Protein:
24.6 g
Fats:
17.9 g
Carbs:
4 g
Water:
47.5 g
Other:
6 g
Contains
more
Water Water
+25.5%
Contains
more
Fats Fats
+56.3%
Contains
more
Carbs Carbs
+∞%
Contains
more
Other Other
+38.9%
Fat Type Comparison
Fat type breakdown side-by-side comparison
1
14%
37%
49%
Saturated fat:
Sat. Fat
1.528 g
Monounsaturated fat:
Mono. Fat
3.869 g
Polyunsaturated fat:
Poly. Fat
5.148 g
2
25%
29%
46%
Saturated fat:
Sat. Fat
4.06 g
Monounsaturated fat:
Mono. Fat
4.631 g
Polyunsaturated fat:
Poly. Fat
7.405 g
Contains
less
Sat. Fat Saturated fat
-62.4%
Contains
more
Mono. Fat Monounsaturated fat
+19.7%
Contains
more
Poly. Fat Polyunsaturated fat
+43.8%