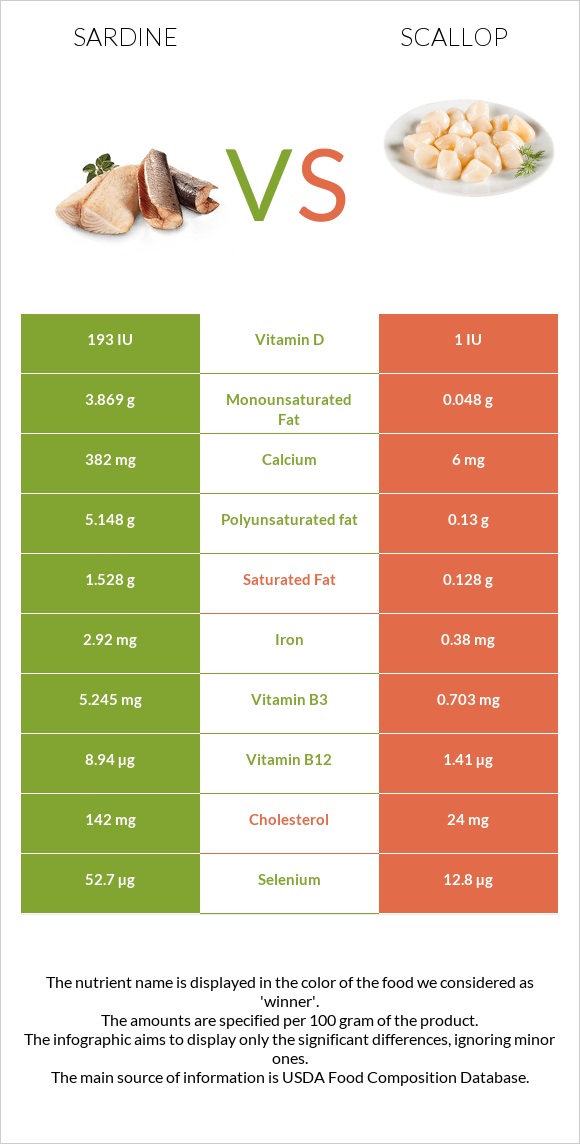
How are sardines and scallops different? Sardines are higher than scallops in vitamin B12, selenium, calcium, iron, vitamin B3, vitamin D*, copper, and vitamin B2. Sardines cover your daily need for vitamin B12, 283% more than scallops. Sardines contain 97 times more vitamin D* than scallops. Sardines contain 193 IU of vitamin D*, while scallops contain 2 IU. Scallops are lower in cholesterol. Fish, sardine, Atlantic, canned in oil, drained solids with bone and Mollusks, scallop, (bay and sea), cooked, steamed types were used in this article.
Infographic
Mineral Comparison
Mineral comparison score is based on the number of minerals by which one or the other food is richer. The "coverage" charts below show how much of the daily needs can be covered by 300 grams of the food.
8
100 g
300 g
1 small (2-2/3" x 1/2" x 1/4") - 12g 1 cubic inch - 16g 2 sardines - 24g 1 oz - 28.35g 1 can (3.75 oz) - 92g 1 cup, drained - 149g
Magnesium
Magnesium
Calcium
Calcium
Potassium
Potassium
Iron
Iron
Copper
Copper
Zinc
Zinc
Phosphorus
Phosphorus
Sodium
Sodium
Manganese
Manganese
Selenium
Selenium
28%
115%
35%
110%
62%
36%
210%
40%
14%
287%
1
100 g
300 g
3 oz - 85g
Magnesium
Magnesium
Calcium
Calcium
Potassium
Potassium
Iron
Iron
Copper
Copper
Zinc
Zinc
Phosphorus
Phosphorus
Sodium
Sodium
Manganese
Manganese
Selenium
Selenium
26%
3%
28%
22%
11%
42%
183%
87%
3.8%
118%
Vitamin Comparison
Vitamin comparison score is based on the number of vitamins by which one or the other food is richer. The "coverage" charts below show how much of the daily needs can be covered by 300 grams of the food.
10
100 g
300 g
1 small (2-2/3" x 1/2" x 1/4") - 12g 1 cubic inch - 16g 2 sardines - 24g 1 oz - 28.35g 1 can (3.75 oz) - 92g 1 cup, drained - 149g
Vitamin C
Vit. C
Vitamin D
Vit. D
Vitamin A
Vit. A
Vitamin E
Vit. E
Vitamin B1
Vit. B1
Vitamin B2
Vit. B2
Vitamin B3
Vit. B3
Vitamin B5
Vit. B5
Vitamin B6
Vit. B6
Vitamin B12
Vit. B12
Vitamin K
Vit. K
Folate
Folate
0%
72%
11%
41%
20%
52%
98%
39%
39%
1118%
6.5%
7.5%
1
100 g
300 g
3 oz - 85g
Vitamin C
Vit. C
Vitamin D
Vit. D
Vitamin A
Vit. A
Vitamin E
Vit. E
Vitamin B1
Vit. B1
Vitamin B2
Vit. B2
Vitamin B3
Vit. B3
Vitamin B5
Vit. B5
Vitamin B6
Vit. B6
Vitamin B12
Vit. B12
Vitamin K
Vit. K
Folate
Folate
0%
0%
0.67%
0%
3%
5.5%
20%
22%
26%
269%
0%
15%
All nutrients comparison - raw data values
Nutrient
DV% diff.
Vitamin B12
8.94µg
2.15µg
283%
Selenium
52.7µg
21.7µg
56%
Calcium
382mg
10mg
37%
Cholesterol
142mg
41mg
34%
Polyunsaturated fat
5.148g
0.222g
33%
Iron
2.92mg
0.58mg
29%
Vitamin B3
5.245mg
1.076mg
26%
Vitamin D*
193 IU
2 IU
24%
Vitamin D
4.8µg
0µg
24%
Copper
0.186mg
0.033mg
17%
Fats
11.45g
0.84g
16%
Sodium
307mg
667mg
16%
Vitamin B2
0.227mg
0.024mg
16%
Vitamin E
2.04mg
0mg
14%
Phosphorus
490mg
426mg
9%
Monounsaturated fat
3.869g
0.082g
9%
Protein
24.62g
20.54g
8%
Vitamin B1
0.08mg
0.012mg
6%
Vitamin B5
0.642mg
0.366mg
6%
Choline
75mg
110.7mg
6%
Saturated fat
1.528g
0.218g
6%
Calories
208kcal
111kcal
5%
Vitamin B6
0.167mg
0.112mg
4%
Vitamin A
32µg
2µg
3%
Manganese
0.108mg
0.029mg
3%
Folate
10µg
20µg
3%
Carbs
0g
5.41g
2%
Potassium
397mg
314mg
2%
Zinc
1.31mg
1.55mg
2%
Starch
3.69g
2%
Vitamin K
2.6µg
0µg
2%
Protein per 100 calories
12g
19g
N/A
Calories per 10 g protein
84kcal
54kcal
N/A
Weight per 100 calories
48g
90g
N/A
Unsaturated / Saturated Fat ratio
5.9
1.4
N/A
Net carbs
0g
5.41g
N/A
Magnesium
39mg
37mg
0%
Trans fat
0.009g
N/A
Tryptophan
0.276mg
0.173mg
0%
Threonine
1.079mg
0.629mg
0%
Isoleucine
1.134mg
0.692mg
0%
Leucine
2.001mg
1.226mg
0%
Lysine
2.26mg
1.258mg
0%
Methionine
0.729mg
0.487mg
0%
Phenylalanine
0.961mg
0.597mg
0%
Valine
1.268mg
0.645mg
0%
Histidine
0.725mg
0.314mg
0%
Omega-3 - EPA
0.473g
0.072g
N/A
Omega-3 - DHA
0.509g
0.104g
N/A
Omega-3 - DPA
0g
0.005g
N/A
Omega-6 - Eicosadienoic acid
0.002g
N/A
Macronutrient Comparison
Macronutrient breakdown side-by-side comparison
3
25%
11%
60%
4%
Protein:
24.62 g
Fats:
11.45 g
Carbs:
0 g
Water:
59.61 g
Other:
4.32 g
2
21%
5%
70%
3%
Protein:
20.54 g
Fats:
0.84 g
Carbs:
5.41 g
Water:
70.25 g
Other:
2.96 g
Contains
more
Protein Protein
+19.9%
Contains
more
Fats Fats
+1263.1%
Contains
more
Other Other
+45.9%
Contains
more
Carbs Carbs
+∞%
Contains
more
Water Water
+17.8%
Fat Type Comparison
Fat type breakdown side-by-side comparison
2
14%
37%
49%
Saturated fat:
Sat. Fat
1.528 g
Monounsaturated fat:
Mono. Fat
3.869 g
Polyunsaturated fat:
Poly. Fat
5.148 g
1
42%
16%
43%
Saturated fat:
Sat. Fat
0.218 g
Monounsaturated fat:
Mono. Fat
0.082 g
Polyunsaturated fat:
Poly. Fat
0.222 g
Contains
more
Mono. Fat Monounsaturated fat
+4618.3%
Contains
more
Poly. Fat Polyunsaturated fat
+2218.9%
Contains
less
Sat. Fat Saturated fat
-85.7%