Salmon vs. Pollock — Health Impact and Nutrition Comparison


Summary
Salmon and pollock differ in appearance, taste, nutrition, and health benefits. Salmon has a rich pink to reddish-orange flesh due to carotenoid pigments, while pollock has pale, off-white flesh that turns misted when cooked. In terms of flavor, salmon is bold and firm, ideal for grilling and smoking, whereas pollock has a mild taste and soft texture, commonly used in processed seafood products.
Nutritionally, salmon is higher in calories, fats, and omega-3 fatty acids, which support heart health and reduce inflammation. Pollock, being leaner, is lower in saturated fats and cholesterol but rich in minerals like selenium and iron.
Both fish offer health benefits, including support for heart health, diabetes management, and potential cancer risk reduction, though salmon's omega-3 content gives it an edge in cardiovascular protection.
Introduction
Salmon and Alaska pollock are popular seafood choices, each with distinct characteristics. In this article, we will go through the actual differences, nutrition profiles, and health impacts of these two species.
Actual Differences
Appearance
Salmon and pollock have noticeable differences in appearance. Salmon typically has a pink to reddish-orange flesh, which varies in intensity depending on the species, such as chinook salmon, which has a deep, rich hue.
The color is due to naturally occurring astaxanthin pigment from their diet (1). Pollock, on the other hand, has a pale, off-white flesh that turns opaque when cooked (2).
The exterior of pollock is speckled with dark patterns, while salmon has a more uniform coloration with silvery skin and black spots along its back. These visual differences make them easily distinguishable in both raw and cooked forms.
Flavor, Texture, and Culinary Use
Salmon has a distinct, bold flavor with a firmer texture due to its higher fat content, making it suitable for grilling, roasting, and smoking. Chinook salmon, for example, is prized for its rich taste and high fatty acids content.
In contrast, Alaska pollock has a more delicate flavor and softer texture, often used in processed seafood products such as fish sticks and imitation crab. Its mild flavor makes it adaptable to various recipes, including baked, fried, and poached dishes. Pollock’s leaner composition means it absorbs seasonings well, making it a great option for dishes that rely on marinades and sauces.
Nutrition
The average serving sizes for both salmon and Alaska pollock are similar. One serving of salmon equals about 3 oz, which is 85 grams. One serving of Alaska pollock is one fillet, around 60 grams.
Macronutrient Comparison
Contains
more
FatsFats
+946.6%
Contains
more
WaterWater
+13.7%
Contains
more
OtherOther
+111.3%
Calories
Salmon is slightly higher in calories compared to Alaska pollock. 100g serving of salmon contains 206 calories, while the same serving of pollock contains 111 calories.
Carbs
Both salmon and pollock do not contain any amounts of carbohydrates.
Proteins
Salmon and Alaska pollock are considered to be high in proteins, although pollocks contain slightly higher levels. Alaska pollock contains 23.5 grams of protein per 100 grams, while salmon contains 22.1 grams.
The essential amino acid profile of pollocks is richer. However, both are considered to have high quantities of essential amino acids.
Fats
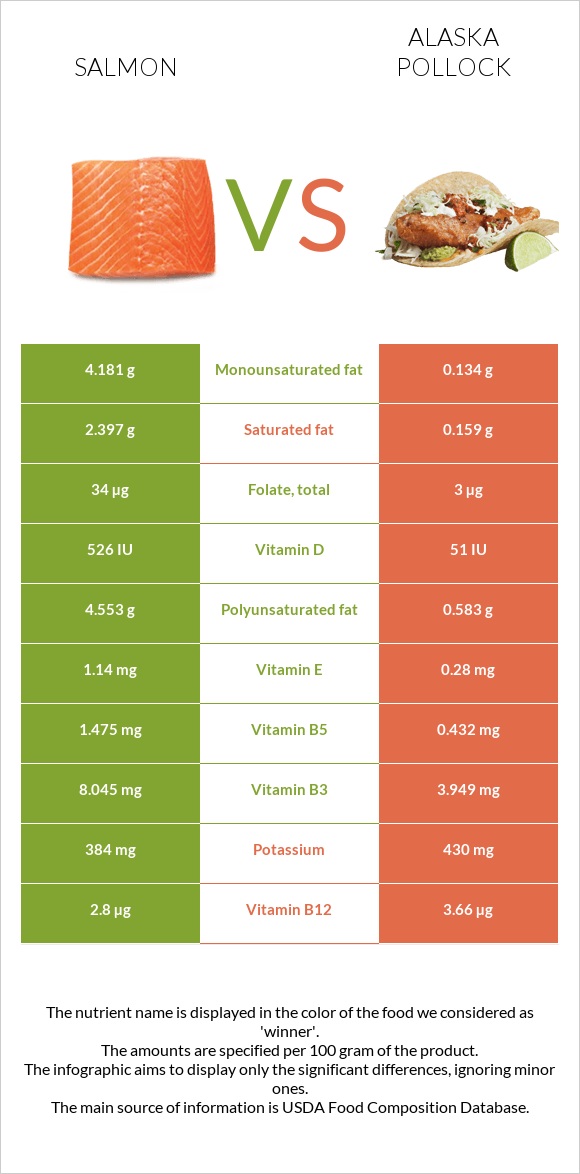
The total fat in Alaska pollock equals 1.18 grams, while in salmon, it is significantly higher and equals 12.4 grams.
Saturated Fats
Salmon has notably higher amounts of saturated fats, equalling 2.4 grams, while Alaska pollock contains 0.2 grams.
Monounsaturated Fats
Per 100-gram serving, salmon is richer in monounsaturated fats by around 4 grams compared to Alaska pollock.
Polyunsaturated Fats and Omega-3 Fatty Acids
Polyunsaturated fats make up the omega-3 essential fatty acids. It is important to note that salmon is richer in polyunsaturated fats by 4 grams.
Fatty fish like salmon are among the richest sources of dietary supply of omega-3 fatty acids, including EPA and DHA (eicosapentaenoic acid and docosahexaenoic acid). These fatty acids are essential fats that have various beneficial properties.
Fat Type Comparison
Contains
more
Mono. FatMonounsaturated fat
+3020.1%
Contains
more
Poly. FatPolyunsaturated fat
+681%
Contains
less
Sat. FatSaturated fat
-93.4%
Cholesterol
Alaska pollocks have higher amounts of cholesterol. Per 100 grams of serving, they contain 86mg, while salmon contains only 63mg. The cholesterol content of 100-gram pollocks is nearly 8% of the daily intake value.
Minerals
Alaska pollocks and salmon are rich in minerals. Both are especially rich in selenium. A 100g serving of pollock and salmon provides 44.1µg and 41.4µg of selenium, respectively, almost completing the daily need for selenium. What is more, compared to salmon, pollocks also contain high amounts of iron, phosphorus, and zinc. It is important to note that pollocks also contain more sodium compared to salmon, which is important to consider, especially among hypertensive patients.
Vitamins
The amount of Vitamin B12 found in a 100-gram serving of Alaska pollock and salmon equals 3.66µg and 2.8µg, respectively. On the other hand, compared to pollocks, salmon is richer in Vitamin D, as well as other B-complex vitamins such as Vitamins B3, B6, and B5. A 100-gram serving of pollocks provides 51 IU of Vitamin D, while the same serving of salmon provides 546 IU, almost enough to cover the daily recommended intake (600 IU).
Health Impact
Heart Health
Salmon is widely recognized for its heart-protective benefits due to its high levels of omega-3 fatty acid, particularly EPA and DHA. These essential nutrients help lower cholesterol levels, regulate blood pressure, and reduce inflammation, all of which contribute to a decreased risk of heart disease (3) (4).
Consuming salmon regularly has been associated with improved arterial function and lower triglyceride levels.
Pollock also provides heart health benefits, though to a lesser extent. As a lean white fish, it contains lower levels of saturated fats and calories, making it a suitable option for those managing their weight and cardiovascular health. While its omega-3 fatty acid content is lower than that of salmon, it still contributes to overall heart health and helps support normal blood pressure levels. Additionally, pollock is a good source of potassium, which plays a role in maintaining healthy heart function (5).
Diabetes
Both salmon and pollock can be beneficial for individuals with diabetes. Salmon’s high content of omega-3 fatty acid helps reduce inflammation and improve insulin sensitivity, which may aid in blood sugar regulation. Additionally, salmon’s protein and healthy fatty acids contribute to stable blood glucose levels and may lower the risk of developing type 2 diabetes (6).
Pollock, being a lean white fish, is also a good option for those managing diabetes. Since Alaska pollock has a lower fat content than salmon, it is often recommended for those looking to control their weight and reduce insulin resistance (7).
Cancer
Salmon and pollock may have different impacts on cancer risk due to their nutritional compositions. The omega-3 fatty acids found in salmon, including EPA and DHA, have been studied for their potential anti-inflammatory properties, which may help lower the risk of certain cancers (8). These compounds can support cellular health and reduce inflammation, which is a contributing factor to cancer development. Additionally, salmon is a good source of vitamin D, which has been linked to cancer prevention, particularly in colorectal cancer.
Some processed pollock products may contain additives or excessive sodium, which should be monitored as high sodium intake has been linked to increased risks of certain cancers, such as stomach cancer (9).
References
- https://www.sciencedirect.com/science/article/abs/pii/B9781845692995500184
- https://www.fisheries.noaa.gov/species/alaska-pollock
- https://pubmed.ncbi.nlm.nih.gov/9028717/
- https://pubmed.ncbi.nlm.nih.gov/8339414/
- https://pmc.ncbi.nlm.nih.gov/articles/PMC8101903/
- https://pubmed.ncbi.nlm.nih.gov/33413727/
- https://pubmed.ncbi.nlm.nih.gov/32885439/
- https://www.sciencedirect.com/science/article/pii/S0022316622104773
- https://pmc.ncbi.nlm.nih.gov/articles/PMC9609108/
- https://www.cancer.gov/about-cancer/causes-prevention/risk/diet/vitamin-d-fact-sheet

Infographic
Mineral Comparison
| Contains less SodiumSodium | -85.4% |
| Contains more MagnesiumMagnesium | +170% |
| Contains more CalciumCalcium | +380% |
| Contains more PotassiumPotassium | +12% |
| Contains more IronIron | +64.7% |
| Contains more CopperCopper | +22.4% |
| Contains more ZincZinc | +32.6% |
| Contains more ManganeseManganese | +12.5% |
Vitamin Comparison
| Contains more Vitamin CVitamin C | +∞% |
| Contains more Vitamin AVitamin A | +305.9% |
| Contains more Vitamin EVitamin E | +307.1% |
| Contains more Vitamin DVitamin D | +907.7% |
| Contains more Vitamin B1Vitamin B1 | +529.6% |
| Contains more Vitamin B3Vitamin B3 | +103.7% |
| Contains more Vitamin B5Vitamin B5 | +241.4% |
| Contains more Vitamin B6Vitamin B6 | +96.7% |
| Contains more FolateFolate | +1033.3% |
| Contains more Vitamin B2Vitamin B2 | +65.2% |
| Contains more Vitamin B12Vitamin B12 | +30.7% |
All nutrients comparison - raw data values
| Nutrient | |
|
DV% diff. |
| Vitamin D | 526 IU | 51 IU | 59% |
| Vitamin D | 13.1µg | 1.3µg | 59% |
| Vitamin B12 | 2.8µg | 3.66µg | 36% |
| Vitamin B3 | 8.045mg | 3.949mg | 26% |
| Polyunsaturated fat | 4.553g | 0.583g | 26% |
| Vitamin B1 | 0.34mg | 0.054mg | 24% |
| Vitamin B6 | 0.647mg | 0.329mg | 24% |
| Vitamin B5 | 1.475mg | 0.432mg | 21% |
| Fats | 12.35g | 1.18g | 17% |
| Sodium | 61mg | 419mg | 16% |
| Magnesium | 30mg | 81mg | 12% |
| Saturated fat | 2.397g | 0.159g | 10% |
| Monounsaturated fat | 4.181g | 0.134g | 10% |
| Cholesterol | 63mg | 86mg | 8% |
| Folate | 34µg | 3µg | 8% |
| Vitamin B2 | 0.135mg | 0.223mg | 7% |
| Calcium | 15mg | 72mg | 6% |
| Vitamin A | 69µg | 17µg | 6% |
| Vitamin E | 1.14mg | 0.28mg | 6% |
| Calories | 206kcal | 111kcal | 5% |
| Selenium | 41.4µg | 44.1µg | 5% |
| Vitamin C | 3.7mg | 0mg | 4% |
| Protein | 22.1g | 23.48g | 3% |
| Iron | 0.34mg | 0.56mg | 3% |
| Phosphorus | 252mg | 267mg | 2% |
| Potassium | 384mg | 430mg | 1% |
| Copper | 0.049mg | 0.06mg | 1% |
| Zinc | 0.43mg | 0.57mg | 1% |
| Manganese | 0.016mg | 0.018mg | 0% |
| Vitamin K | 0.1µg | 0.1µg | 0% |
| Choline | 90.5mg | 91.6mg | 0% |
| Tryptophan | 0.248mg | 0.263mg | 0% |
| Threonine | 0.969mg | 1.029mg | 0% |
| Isoleucine | 1.018mg | 1.082mg | 0% |
| Leucine | 1.796mg | 1.908mg | 0% |
| Lysine | 2.03mg | 2.157mg | 0% |
| Methionine | 0.654mg | 0.696mg | 0% |
| Phenylalanine | 0.863mg | 0.917mg | 0% |
| Valine | 1.139mg | 1.21mg | 0% |
| Histidine | 0.651mg | 0.691mg | 0% |
| Omega-3 - EPA | 0.69g | 0.086g | N/A |
| Omega-3 - DHA | 1.457g | 0.423g | N/A |
| Omega-3 - DPA | 0.17g | 0.027g | N/A |
People also compare


References
All the values for which the sources are not specified explicitly are taken from FDA’s Food Central. The exact link to the food presented on this page can be found below.
- Salmon - https://fdc.nal.usda.gov/fdc-app.html#/food-details/175168/nutrients
- Pollock - https://fdc.nal.usda.gov/fdc-app.html#/food-details/173681/nutrients
All the Daily Values are presented for males aged 31-50, for 2000-calorie diets.