Salmon vs. Chicken meat — Health Impact and Nutrition Comparison


Summary
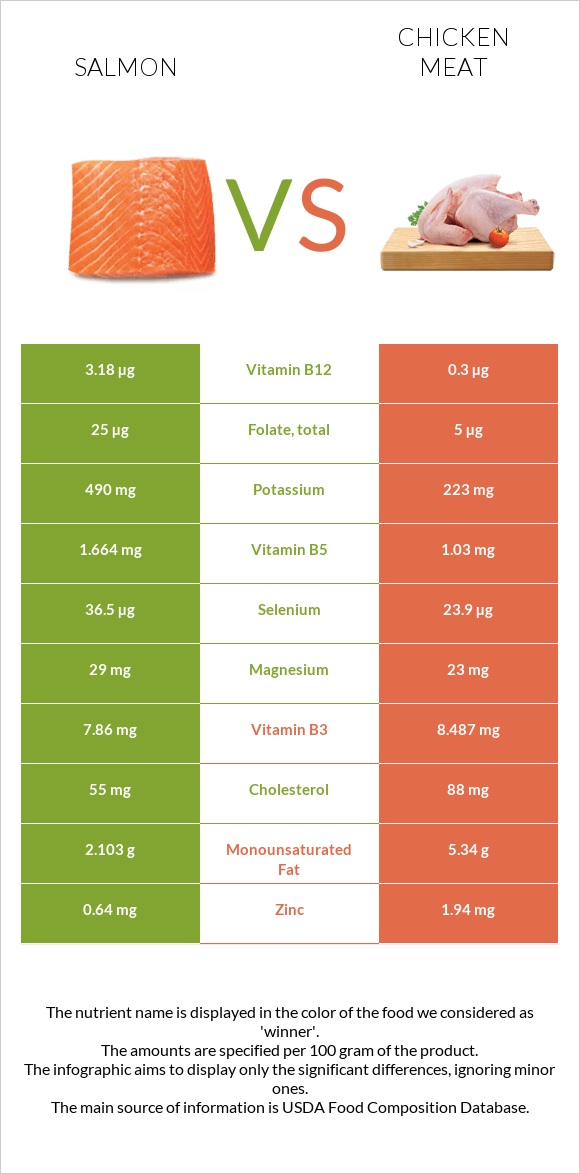
In summary, chicken is higher in calories and macronutrients, such as protein and fats; however, salmon has a more favorable fat profile and is lower in cholesterol.
Salmon is the ultimate winner in the vitamin category, containing nine times more vitamin B12, seven times more folate, five times more vitamin B1, and more.
While chicken is more affluent in zinc and iron, salmon is a better potassium, phosphorus, and magnesium source. Salmon is also lower in sodium.
According to research, salmon intake may help decrease the risk of cardiovascular disease and type 2 diabetes, whereas chicken seems to have a neutral impact.
Introduction
Salmon and chicken are both popular choices for meat consumption, and each has its own unique characteristics, but which is healthier and which is nutritionally superior? In this article, we will try to answer some of these questions.
Classification
It is widely known that chicken is poultry and is classified as white meat, but is salmon also white meat? The answer is yes; fish, such as salmon, along with poultry, is considered to be white meat.
White meat is lower in iron-containing protein myoglobin compared to red meat. This protein gives red meat its color. However, unlike in red meat, the red tint of raw salmon is not due to this pigment. Salmon usually gets its orange shade from containing carotenoids, which become a source of vitamin A in the body.
Appearance, Taste, and Use
As described above, raw salmon has hues of orange to red, while chicken is light pink. However, salmon loses its color after being cooked.
Moreover, salmon meat has marbling, which is visible white streaks. Whether the fish was farm-raised or wild-caught, these lines can be more obvious or hardly discernible.
Salmon has a distinctly rich and buttery flavor that many people enjoy. It has a tender and flaky texture. Chicken, on the other hand, has a milder flavor and a firmer texture.
Salmon can be cooked in various ways, such as grilling, baking, and pan-frying. Chicken is versatile and can be cooked in many ways, like grilling, roasting, and stir-frying.
Price
Salmon is generally more expensive than chicken due to its relatively higher demand with lower availability.
Nutrition
The nutritional information used in our article is presented for 100g servings of roasted chicken broilers or fryers, with meat and skin, and farmed Atlantic salmon, cooked with dry heat.
The average serving size per person is one cup of chopped or diced chicken, equal to around 140g, and 3 ounces of salmon, equal to 85g. However, half a filet of salmon weighs around 178g.
Macronutrients and Calories
While these two foods are similar, chicken, being composed of 59% water and 41% nutrients, is slightly denser in nutrients. Salmon consists of 65% water and 35% nutrients.
Macronutrient Comparison
Contains
more
OtherOther
+∞%
Contains
more
ProteinProtein
+23.5%
Contains
more
FatsFats
+10.1%
Calories
Both salmon and chicken are high in calories; however, chicken has slightly more calories. Chicken provides 239 calories per 100g serving, while this number for salmon is 206.
Protein
Chicken is also richer in protein, providing 27.3g per 100g serving. At the same time, salmon is also a great source of protein, containing 22.1g per 100g serving.
Both chicken and salmon contain high levels of all essential amino acids. Chicken meat is richer in all of them.
Fats
Like with other macronutrients, chicken is also higher in fats. A 100g serving of chicken and salmon provides 13.6g and 12.4g of fats, respectively.
However, salmon has a more favorable fat composition, as it contains only 22% saturated fats and 78% unsaturated fats. Salmon’s predominant fat type is polyunsaturated fat. Chicken fat, on the other hand, consists of 31% saturated and 69% unsaturated fats, with the primary fat type being monounsaturated fats.
Fat Type Comparison
Contains
less
Sat. FatSaturated fat
-36.8%
Contains
more
Poly. FatPolyunsaturated fat
+53.3%
Contains
more
Mono. FatMonounsaturated fat
+27.7%
Salmon is also unsurprisingly lower in cholesterol by 25mg per every 100g serving.
Carbohydrates
Like other types of meat, unprocessed salmon and chicken do not contain notable amounts of carbohydrates.
Vitamins
Salmon is the ultimate winner in the vitamin category. Salmon provides nine times more vitamin B12, seven times more vitamin B9 or folate, five times more vitamin B1, and four times more vitamin E. It is also a better source of vitamins A, D, and C and vitamins B5 and B6.
At the same time, chicken contains 24 times more vitamin K and, overall, more vitamin B2.
Vitamin Comparison
Contains
more
Vitamin CVitamin C
+∞%
Contains
more
Vitamin DVitamin D
+∞%
Contains
more
Vitamin AVitamin A
+43.8%
Contains
more
Vitamin EVitamin E
+322.2%
Contains
more
Vitamin B1Vitamin B1
+439.7%
Contains
more
Vitamin B5Vitamin B5
+43.2%
Contains
more
Vitamin B6Vitamin B6
+61.8%
Contains
more
Vitamin B12Vitamin B12
+833.3%
Contains
more
FolateFolate
+580%
Contains
more
Vitamin B2Vitamin B2
+24.4%
Contains
more
Vitamin KVitamin K
+2300%
Minerals
Salmon and chicken are both excellent sources of minerals.
Chicken is around five times richer in zinc, four times richer in iron, and overall higher in calcium.
Salmon, however, is a better potassium, phosphorus, and magnesium source. Salmon is also lower in sodium.
Mineral Comparison
Contains
more
MagnesiumMagnesium
+30.4%
Contains
more
PotassiumPotassium
+72.2%
Contains
more
PhosphorusPhosphorus
+38.5%
Contains
less
SodiumSodium
-25.6%
Contains
more
SeleniumSelenium
+73.2%
Contains
more
IronIron
+270.6%
Contains
more
CopperCopper
+34.7%
Contains
more
ZincZinc
+351.2%
Contains
more
ManganeseManganese
+25%
Glycemic Index
The glycemic index of foods with no carbohydrates, such as salmon and chicken meat, is considered to be 0, as these foods do not raise blood glucose levels.
Insulin Index
The insulin index of foods is another way of looking at the food’s impact on the body. It measures how much the consumption of a given food raises blood insulin levels.
The insulin index of roast chicken is 23 (1). This is considered to be a low insulin index value, but no studies have been carried out on the value of salmon.
Another research has found the insulin index of chicken to be 17 (2).
Weight Loss & Diets
Salmon and chicken meat are good options for high protein, keto, and other low-carb diets. Conversely, these are not the best choices of food for low-fat and low-calorie diets.
That being said, despite the high-calorie content, lean or fatty fish and seafood, in general, can help people lose weight when included in a healthy, energy-restricted diet (3). Another study discovered that giving overweight participants hydrolysate - a protein supplement found in salmon - had a beneficial impact on their body mass index (4).
Similarly, research shows that together with a diet high in vegetables, the intake of poultry meat, such as chicken, has been linked to a lower risk of gaining excess fat and obesity (5).
Chicken and salmon are obviously not allowed on vegetarian and vegan diets. However, unlike chicken, salmon can be a good source of nutrients on a pescetarian diet.
Health Impact
Cardiovascular Health
When added to a weight-loss regimen, fish products high in omega-3 fatty acids, such as salmon, can significantly lower cardiovascular risk in obese people with high blood pressure (6).
Omega-3 fatty acids have been discovered to beneficially impact triglyceride levels, blood pressure, hemostasis, arrhythmia, atherosclerosis, vasodilation, and thrombosis overall. They can also be helpful in the prevention and treatment of heart disease by enhancing the function of the heart (7).
Substituting chicken for red meat can decrease cardiovascular disease risk (8). However, while the intake of chicken may not lead to increased cardiovascular disease and all-cause mortality, unlike red meat, it has not yet been conclusively proven to improve cardiovascular risk (9).
Overall, there is evidence that consuming fish, such as salmon, instead of poultry, such as chicken, can lower the risk of cardiovascular disease (10).
Diabetes
Chicken and salmon both have low glycemic and insulin index values, demonstrating that the consumption of these foods does not increase blood glucose or insulin levels.
Several studies have proven a connection between saturated fat consumption from animal sources, insulin resistance, and hyperinsulinemia. However, no statistically significant link has been found between increased weekly consumption of chicken and the onset of the disease, according to data on poultry consumption (11).
Salmon, on the other hand, has been researched to have various beneficial effects on diabetes mellitus.
Oligopeptide proteins from salmon skin dramatically lowered fasting blood glucose, demonstrating antidiabetic properties (12). It has also been discovered that salmon skin gelatin can increase insulin secretion and promote glycemic management (13). Consuming lean fish overall may help prevent type 2 diabetes overall, according to research (14).
Speaking of factors that influence the likelihood of developing type 2 diabetes, the cooking process may be just as important as the product itself. When compared to cooking at moderate temperatures, such as boiling, steaming, and stir-frying, cooking meat at high temperatures, such as grilling and barbecuing, increases the risk of type 2 diabetes (15).
Sources.
- https://www.researchgate.net/publication/26770180
- https://ses.library.usyd.edu.au/handle/2123/11945
- https://www.nature.com/articles/0803643
- https://www.researchgate.net/publication/297727596
- https://www.ncbi.nlm.nih.gov/pmc/articles/PMC4462824/
- https://academic.oup.com/ajcn/article/70/5/817/4729086
- https://www.ncbi.nlm.nih.gov/pmc/articles/PMC3712371/
- https://www.ncbi.nlm.nih.gov/pubmed/16002829/
- https://jamanetwork.com/journals/jamainternalmedicine/fullarticle/2759737
- https://academic.oup.com/eurheartj/article/42/12/1136/6032616
- https://www.ncbi.nlm.nih.gov/pmc/articles/PMC4462824/
- https://pubmed.ncbi.nlm.nih.gov/20541363/
- https://pubmed.ncbi.nlm.nih.gov/25946069/
- https://journals.plos.org/plosone/article?id=10.1371/journal.pone.0089845
- https://www.hsph.harvard.edu/nutritionsource/2018/03/23/how-meat-is-cooked-may-affect-risk-of-type-2-diabetes/

Infographic
All nutrients comparison - raw data values
| Nutrient | |
|
DV% diff. |
| Vitamin B12 | 2.8µg | 0.3µg | 104% |
| Vitamin D* | 526 IU | 2 IU | 66% |
| Vitamin D | 13.1µg | 0µg | 66% |
| Selenium | 41.4µg | 23.9µg | 32% |
| Vitamin B1 | 0.34mg | 0.063mg | 23% |
| Vitamin B6 | 0.647mg | 0.4mg | 19% |
| Zinc | 0.43mg | 1.94mg | 14% |
| Iron | 0.34mg | 1.26mg | 12% |
| Polyunsaturated fat | 4.553g | 2.97g | 11% |
| Protein | 22.1g | 27.3g | 10% |
| Phosphorus | 252mg | 182mg | 10% |
| Vitamin B5 | 1.475mg | 1.03mg | 9% |
| Cholesterol | 63mg | 88mg | 8% |
| Folate | 34µg | 5µg | 7% |
| Vitamin E | 1.14mg | 0.27mg | 6% |
| Saturated fat | 2.397g | 3.79g | 6% |
| Potassium | 384mg | 223mg | 5% |
| Vitamin C | 3.7mg | 0mg | 4% |
| Choline | 90.5mg | 65.9mg | 4% |
| Vitamin B2 | 0.135mg | 0.168mg | 3% |
| Vitamin B3 | 8.045mg | 8.487mg | 3% |
| Monounsaturated fat | 4.181g | 5.34g | 3% |
| Calories | 206kcal | 239kcal | 2% |
| Fats | 12.35g | 13.6g | 2% |
| Magnesium | 30mg | 23mg | 2% |
| Copper | 0.049mg | 0.066mg | 2% |
| Vitamin A | 69µg | 48µg | 2% |
| Vitamin K | 0.1µg | 2.4µg | 2% |
| Sodium | 61mg | 82mg | 1% |
| Protein per 100 calories | 11g | 11g | N/A |
| Calories per 10 g protein | 93kcal | 88kcal | N/A |
| Weight per 100 calories | 49g | 42g | N/A |
| Unsaturated / Saturated Fat ratio | 3.6 | 2.2 | N/A |
| Calcium | 15mg | 15mg | 0% |
| Manganese | 0.016mg | 0.02mg | 0% |
| Tryptophan | 0.248mg | 0.305mg | 0% |
| Threonine | 0.969mg | 1.128mg | 0% |
| Isoleucine | 1.018mg | 1.362mg | 0% |
| Leucine | 1.796mg | 1.986mg | 0% |
| Lysine | 2.03mg | 2.223mg | 0% |
| Methionine | 0.654mg | 0.726mg | 0% |
| Phenylalanine | 0.863mg | 1.061mg | 0% |
| Valine | 1.139mg | 1.325mg | 0% |
| Histidine | 0.651mg | 0.802mg | 0% |
| Omega-3 - EPA | 0.69g | 0.01g | N/A |
| Omega-3 - DHA | 1.457g | 0.04g | N/A |
| Omega-3 - DPA | 0.17g | 0.02g | N/A |
People also compare


References
All the values for which the sources are not specified explicitly are taken from FDA’s Food Central. The exact link to the food presented on this page can be found below.
- Salmon - https://fdc.nal.usda.gov/fdc-app.html#/food-details/175168/nutrients
- Chicken meat - https://fdc.nal.usda.gov/fdc-app.html#/food-details/171450/nutrients
All the Daily Values are presented for males aged 31-50, for 2000-calorie diets.