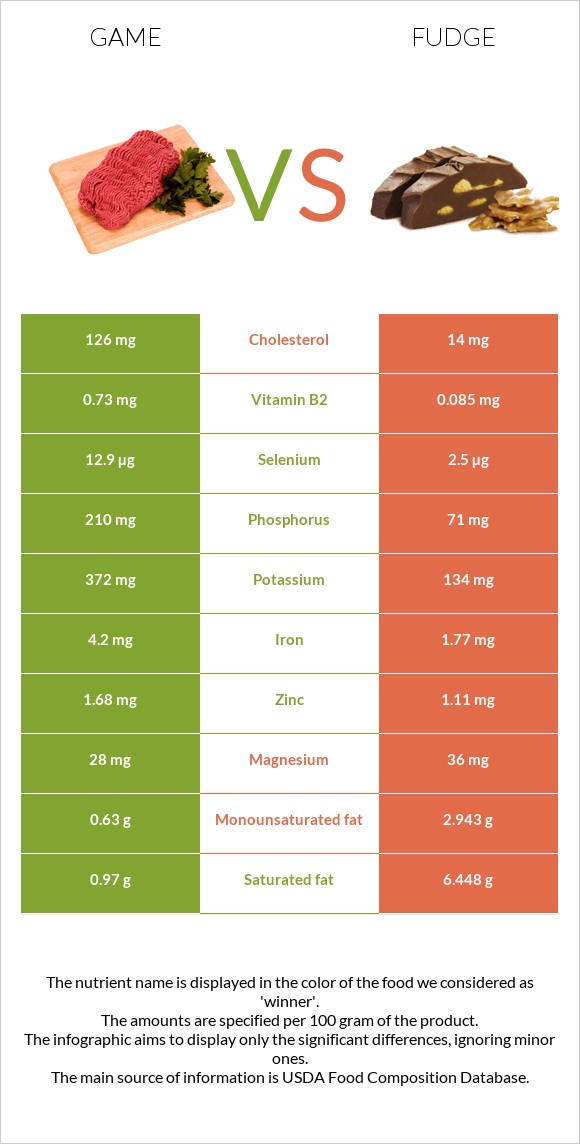
A recap on the differences between game and fudge Game has more vitamin B2, iron, phosphorus, vitamin B1, selenium, and potassium; however, fudge is higher in manganese and copper. Game covers your daily vitamin B2 needs 50% more than fudge. Fudge contains 10 times less vitamin B1 than game. Game contains 0.26mg of vitamin B1, while fudge contains 0.026mg. Fudge has less cholesterol. The glycemic index of fudge is higher. Food varieties used in this article are Game meat, antelope, cooked, roasted and Candies, fudge, chocolate, prepared-from-recipe .
Infographic
Mineral Comparison
Mineral comparison score is based on the number of minerals by which one or the other food is richer. The "coverage" charts below show how much of the daily needs can be covered by 300 grams of the food.
5
100 g
300 g
3 oz - 85g 1 piece, cooked (yield from 1 lb raw meat, boneless) - 340g
Magnesium
Magnesium
Calcium
Calcium
Potassium
Potassium
Iron
Iron
Copper
Copper
Zinc
Zinc
Phosphorus
Phosphorus
Sodium
Sodium
Manganese
Manganese
Selenium
Selenium
20%
1.2%
33%
158%
71%
46%
90%
7%
2.9%
70%
5
100 g
300 g
1 piece - 17g
Magnesium
Magnesium
Calcium
Calcium
Potassium
Potassium
Iron
Iron
Copper
Copper
Zinc
Zinc
Phosphorus
Phosphorus
Sodium
Sodium
Manganese
Manganese
Selenium
Selenium
26%
15%
12%
66%
110%
30%
30%
5.9%
55%
14%
Vitamin Comparison
Vitamin comparison score is based on the number of vitamins by which one or the other food is richer. The "coverage" charts below show how much of the daily needs can be covered by 300 grams of the food.
3
100 g
300 g
3 oz - 85g 1 piece, cooked (yield from 1 lb raw meat, boneless) - 340g
Vitamin C
Vit. C
Vitamin D
Vit. D
Vitamin A
Vit. A
Vitamin E
Vit. E
Vitamin B1
Vit. B1
Vitamin B2
Vit. B2
Vitamin B3
Vit. B3
Vitamin B5
Vit. B5
Vitamin B6
Vit. B6
Vitamin B12
Vit. B12
Vitamin K
Vit. K
Folate
Folate
0%
0%
0%
0%
65%
168%
0%
0%
0%
0%
0%
6.8%
7
100 g
300 g
1 piece - 17g
Vitamin C
Vit. C
Vitamin D
Vit. D
Vitamin A
Vit. A
Vitamin E
Vit. E
Vitamin B1
Vit. B1
Vitamin B2
Vit. B2
Vitamin B3
Vit. B3
Vitamin B5
Vit. B5
Vitamin B6
Vit. B6
Vitamin B12
Vit. B12
Vitamin K
Vit. K
Folate
Folate
0%
0%
15%
3.6%
6.5%
20%
3.3%
8.4%
2.8%
11%
3.5%
3%
All nutrients comparison - raw data values
Nutrient
DV% diff.
Protein
29.45g
2.39g
54%
Vitamin B2
0.73mg
0.085mg
50%
Cholesterol
126mg
14mg
37%
Iron
4.2mg
1.77mg
30%
Carbs
0g
76.44g
25%
Saturated fat
0.97g
6.448g
25%
Phosphorus
210mg
71mg
20%
Vitamin B1
0.26mg
0.026mg
20%
Selenium
12.9µg
2.5µg
19%
Manganese
0.022mg
0.422mg
17%
Calories
150kcal
411kcal
13%
Copper
0.213mg
0.329mg
13%
Fats
2.67g
10.41g
12%
Potassium
372mg
134mg
7%
Fiber
0g
1.7g
7%
Monounsaturated fat
0.63g
2.943g
6%
Calcium
4mg
49mg
5%
Zinc
1.68mg
1.11mg
5%
Vitamin A
44µg
5%
Vitamin B12
0.09µg
4%
Vitamin B5
0.14mg
3%
Magnesium
28mg
36mg
2%
Choline
10mg
2%
Caffeine
8mg
2%
Vitamin E
0.18mg
1%
Vitamin B3
0.176mg
1%
Vitamin B6
0.012mg
1%
Vitamin K
1.4µg
1%
Folate
9µg
4µg
1%
Polyunsaturated fat
0.58g
0.373g
1%
Protein per 100 calories
20g
0.58g
N/A
Calories per 10 g protein
51kcal
1720kcal
N/A
Weight per 100 calories
67g
24g
N/A
Unsaturated / Saturated Fat ratio
1.2
0.51
N/A
Net carbs
0g
74.74g
N/A
Sugar
73.12g
N/A
Sodium
54mg
45mg
0%
Trans fat
0.165g
N/A
Threonine
1.362mg
0%
Isoleucine
1.126mg
0%
Leucine
2.489mg
0%
Lysine
2.462mg
0%
Methionine
0.838mg
0%
Phenylalanine
1.166mg
0%
Valine
1.31mg
0%
Histidine
1.401mg
0%
Macronutrient Comparison
Macronutrient breakdown side-by-side comparison
3
29%
3%
66%
2%
Protein:
29.45 g
Fats:
2.67 g
Carbs:
0 g
Water:
65.9 g
Other:
1.98 g
2
2%
10%
76%
10%
Protein:
2.39 g
Fats:
10.41 g
Carbs:
76.44 g
Water:
9.81 g
Other:
0.95 g
Contains
more
Protein Protein
+1132.2%
Contains
more
Water Water
+571.8%
Contains
more
Other Other
+108.4%
Contains
more
Fats Fats
+289.9%
Contains
more
Carbs Carbs
+∞%
Fat Type Comparison
Fat type breakdown side-by-side comparison
2
44%
29%
27%
Saturated fat:
Sat. Fat
0.97 g
Monounsaturated fat:
Mono. Fat
0.63 g
Polyunsaturated fat:
Poly. Fat
0.58 g
1
66%
30%
4%
Saturated fat:
Sat. Fat
6.448 g
Monounsaturated fat:
Mono. Fat
2.943 g
Polyunsaturated fat:
Poly. Fat
0.373 g
Contains
less
Sat. Fat Saturated fat
-85%
Contains
more
Poly. Fat Polyunsaturated fat
+55.5%
Contains
more
Mono. Fat Monounsaturated fat
+367.1%