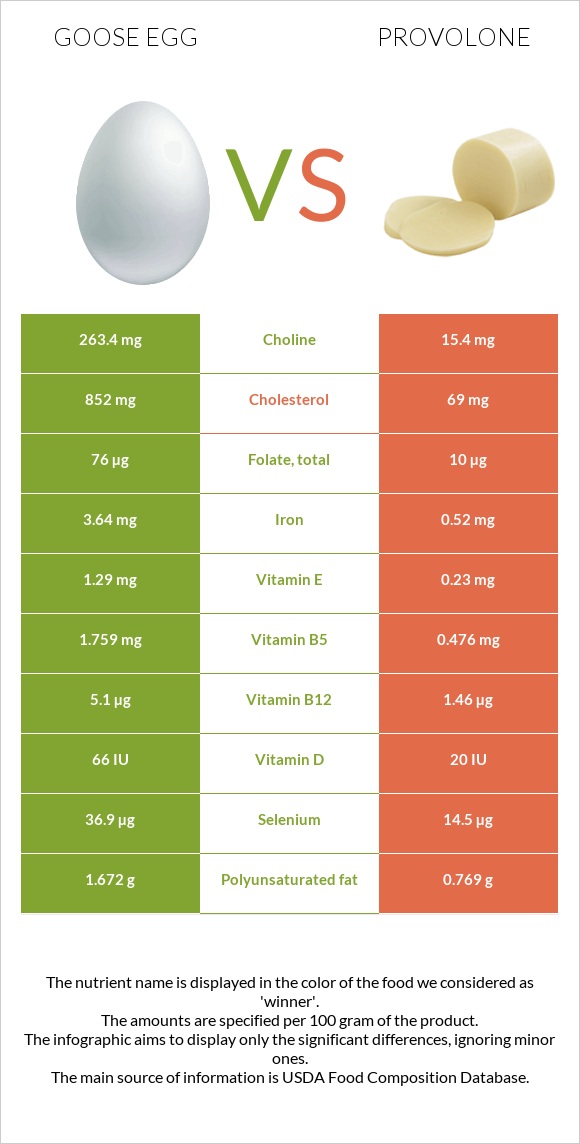
The main differences between goose eggs and provolone Goose eggs are richer in vitamin B12, choline, selenium, iron, and vitamin B5, yet provolone is richer in calcium and phosphorus. Daily need coverage for cholesterol for goose eggs is 261% higher. Goose eggs contain 17 times more choline than provolone. Goose eggs contain 263.4mg of choline, while provolone contains 15.4mg. Provolone contains less cholesterol. Food types used in this article are Egg, goose, whole, fresh, raw and Cheese, provolone .
Infographic
Mineral Comparison
Mineral comparison score is based on the number of minerals by which one or the other food is richer. The "coverage" charts below show how much of the daily needs can be covered by 300 grams of the food.
6
100 g
300 g
1 egg - 144g
Magnesium
Magnesium
Calcium
Calcium
Potassium
Potassium
Iron
Iron
Copper
Copper
Zinc
Zinc
Phosphorus
Phosphorus
Sodium
Sodium
Manganese
Manganese
Selenium
Selenium
11%
18%
19%
137%
21%
36%
89%
18%
5%
201%
4
100 g
300 g
1 cubic inch - 17g 1 slice (1 oz) - 28g 1 oz - 28.35g 1 cup, diced - 132g 1 package (6 oz) - 170g
Magnesium
Magnesium
Calcium
Calcium
Potassium
Potassium
Iron
Iron
Copper
Copper
Zinc
Zinc
Phosphorus
Phosphorus
Sodium
Sodium
Manganese
Manganese
Selenium
Selenium
20%
227%
12%
20%
8.7%
88%
213%
114%
1.3%
79%
Vitamin Comparison
Vitamin comparison score is based on the number of vitamins by which one or the other food is richer. The "coverage" charts below show how much of the daily needs can be covered by 300 grams of the food.
9
100 g
300 g
1 egg - 144g
Vitamin C
Vit. C
Vitamin D
Vit. D
Vitamin A
Vit. A
Vitamin E
Vit. E
Vitamin B1
Vit. B1
Vitamin B2
Vit. B2
Vitamin B3
Vit. B3
Vitamin B5
Vit. B5
Vitamin B6
Vit. B6
Vitamin B12
Vit. B12
Vitamin K
Vit. K
Folate
Folate
0%
26%
62%
26%
37%
88%
3.5%
106%
54%
638%
1%
57%
2
100 g
300 g
1 cubic inch - 17g 1 slice (1 oz) - 28g 1 oz - 28.35g 1 cup, diced - 132g 1 package (6 oz) - 170g
Vitamin C
Vit. C
Vitamin D
Vit. D
Vitamin A
Vit. A
Vitamin E
Vit. E
Vitamin B1
Vit. B1
Vitamin B2
Vit. B2
Vitamin B3
Vit. B3
Vitamin B5
Vit. B5
Vitamin B6
Vit. B6
Vitamin B12
Vit. B12
Vitamin K
Vit. K
Folate
Folate
0%
7.5%
79%
4.6%
4.8%
74%
2.9%
29%
17%
183%
5.5%
7.5%
All nutrients comparison - raw data values
Nutrient
DV% diff.
Cholesterol
852mg
69mg
261%
Vitamin B12
5.1µg
1.46µg
152%
Calcium
60mg
756mg
70%
Saturated fat
3.595g
17.078g
61%
Choline
263.4mg
15.4mg
45%
Phosphorus
208mg
496mg
41%
Selenium
36.9µg
14.5µg
41%
Iron
3.64mg
0.52mg
39%
Sodium
138mg
876mg
32%
Vitamin B5
1.759mg
0.476mg
26%
Protein
13.87g
25.58g
23%
Fats
13.27g
26.62g
21%
Zinc
1.33mg
3.23mg
17%
Folate
76µg
10µg
17%
Vitamin B6
0.236mg
0.073mg
13%
Vitamin B1
0.147mg
0.019mg
11%
Calories
185kcal
351kcal
8%
Vitamin E
1.29mg
0.23mg
7%
Vitamin D*
66 IU
20 IU
6%
Vitamin D
1.7µg
0.5µg
6%
Polyunsaturated fat
1.672g
0.769g
6%
Vitamin A
187µg
236µg
5%
Vitamin B2
0.382mg
0.321mg
5%
Copper
0.062mg
0.026mg
4%
Monounsaturated fat
5.747g
7.393g
4%
Magnesium
16mg
28mg
3%
Potassium
210mg
138mg
2%
Vitamin K
0.4µg
2.2µg
2%
Manganese
0.038mg
0.01mg
1%
Protein per 100 calories
7.5g
7.3g
N/A
Calories per 10 g protein
133kcal
137kcal
N/A
Weight per 100 calories
54g
28g
N/A
Unsaturated / Saturated Fat ratio
2.1
0.48
N/A
Net carbs
1.35g
2.14g
N/A
Carbs
1.35g
2.14g
0%
Sugar
0.94g
0.56g
N/A
Vitamin B3
0.189mg
0.156mg
0%
Tryptophan
0.282mg
0.345mg
0%
Threonine
0.797mg
0.982mg
0%
Isoleucine
0.647mg
1.091mg
0%
Leucine
1.188mg
2.297mg
0%
Lysine
1.03mg
2.646mg
0%
Methionine
0.624mg
0.686mg
0%
Phenylalanine
0.91mg
1.287mg
0%
Valine
0.958mg
1.64mg
0%
Histidine
0.346mg
1.115mg
0%
Macronutrient Comparison
Macronutrient breakdown side-by-side comparison
1
14%
13%
70%
Protein:
13.87 g
Fats:
13.27 g
Carbs:
1.35 g
Water:
70.43 g
Other:
1.08 g
4
26%
27%
2%
41%
5%
Protein:
25.58 g
Fats:
26.62 g
Carbs:
2.14 g
Water:
40.95 g
Other:
4.71 g
Contains
more
Water Water
+72%
Contains
more
Protein Protein
+84.4%
Contains
more
Fats Fats
+100.6%
Contains
more
Carbs Carbs
+58.5%
Contains
more
Other Other
+336.1%
Fat Type Comparison
Fat type breakdown side-by-side comparison
2
33%
52%
15%
Saturated fat:
Sat. Fat
3.595 g
Monounsaturated fat:
Mono. Fat
5.747 g
Polyunsaturated fat:
Poly. Fat
1.672 g
1
68%
29%
3%
Saturated fat:
Sat. Fat
17.078 g
Monounsaturated fat:
Mono. Fat
7.393 g
Polyunsaturated fat:
Poly. Fat
0.769 g
Contains
less
Sat. Fat Saturated fat
-78.9%
Contains
more
Poly. Fat Polyunsaturated fat
+117.4%
Contains
more
Mono. Fat Monounsaturated fat
+28.6%