Grenadine vs. Pico de gallo — In-Depth Nutrition Comparison
Compare
What are the differences between grenadine and pico de gallo?
- Pico de gallo is richer than grenadine in vitamin A.
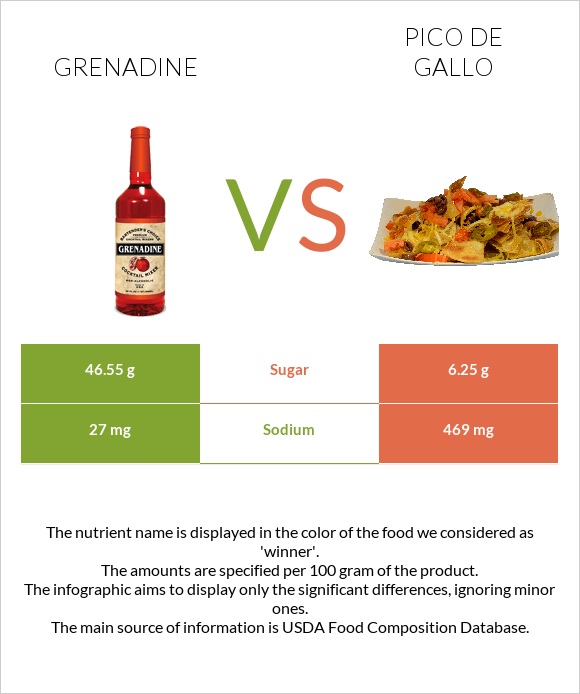
- Pico de gallo's daily need coverage for sodium is 19% more.
- Grenadine has 7 times more sugar than pico de gallo. While grenadine has 46.55g of sugar, pico de gallo has only 6.25g.
We used Syrups, grenadine and PACE, Pico De Gallo types in this article.
Infographic
Infographic link
Mineral Comparison
Mineral comparison score is based on the number of minerals by which one or the other food is richer. The "coverage" charts below show how much of the daily needs can be covered by 300 grams of the food.
| Contains more MagnesiumMagnesium | +∞% |
| Contains more CalciumCalcium | +∞% |
| Contains more PotassiumPotassium | +∞% |
| Contains more IronIron | +∞% |
| Contains more CopperCopper | +∞% |
| Contains more ZincZinc | +∞% |
| Contains more PhosphorusPhosphorus | +∞% |
| Contains less SodiumSodium | -94.2% |
| Contains more SeleniumSelenium | +∞% |
Vitamin Comparison
Vitamin comparison score is based on the number of vitamins by which one or the other food is richer. The "coverage" charts below show how much of the daily needs can be covered by 300 grams of the food.
| Contains more Vitamin B2Vitamin B2 | +∞% |
| Contains more Vitamin CVitamin C | +∞% |
All nutrients comparison - raw data values
| Nutrient |  |
 |
DV% diff. |
| Carbs | 66.91g | 9.38g | 19% |
| Sodium | 27mg | 469mg | 19% |
| Calories | 268kcal | 31kcal | 12% |
| Vitamin C | 0mg | 3.8mg | 4% |
| Copper | 0.026mg | 3% | |
| Magnesium | 4mg | 1% | |
| Calcium | 6mg | 0mg | 1% |
| Potassium | 28mg | 1% | |
| Iron | 0.05mg | 0mg | 1% |
| Zinc | 0.13mg | 1% | |
| Phosphorus | 4mg | 1% | |
| Selenium | 0.6µg | 1% | |
| Vitamin B2 | 0.01mg | 1% | |
| Net carbs | 66.91g | 9.38g | N/A |
| Sugar | 46.55g | 6.25g | N/A |
Macronutrient Comparison
Macronutrient breakdown side-by-side comparison
Protein:
0 g
Fats:
0 g
Carbs:
66.91 g
Water:
32.4 g
Other:
0.69 g
Protein:
0 g
Fats:
0 g
Carbs:
9.38 g
Water:
88 g
Other:
2.62 g
| Contains more CarbsCarbs | +613.3% |
| Contains more WaterWater | +171.6% |
| Contains more OtherOther | +279.7% |
~equal in
Protein
~0g
~equal in
Fats
~0g


