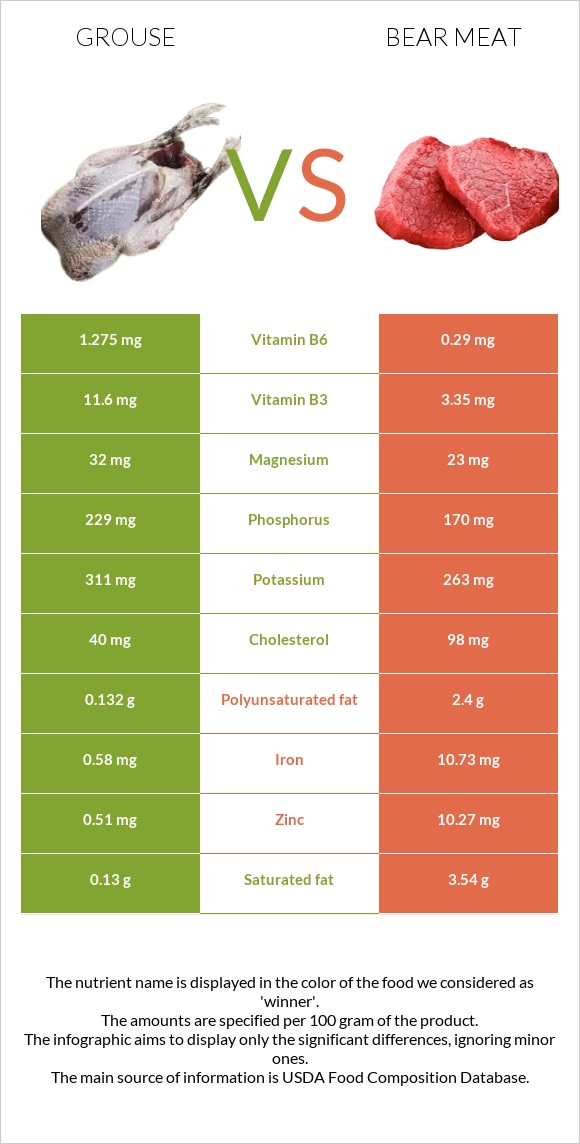
Significant differences between grouse and bear meat Grouse has more vitamin B6, vitamin B3, vitamin B12, and phosphorus; however, bear meat is richer in iron, zinc, vitamin B2, and copper. Bear meat covers your daily iron needs 127% more than grouse. Bear meat has 4 times less vitamin B6 than grouse. Grouse has 1.275mg of vitamin B6, while bear meat has 0.29mg. Grouse contains less cholesterol. Specific food types used in this comparison are Ruffed Grouse, breast meat, skinless, raw and Game meat, bear, cooked, simmered .
Infographic
Mineral Comparison
Mineral comparison score is based on the number of minerals by which one or the other food is richer. The "coverage" charts below show how much of the daily needs can be covered by 300 grams of the food.
5
100 g
300 g
4 oz - 113g 1 breast - 219g 1 bird - 627g
Magnesium
Magnesium
Calcium
Calcium
Potassium
Potassium
Iron
Iron
Copper
Copper
Zinc
Zinc
Phosphorus
Phosphorus
Sodium
Sodium
Manganese
Manganese
Selenium
Selenium
23%
1.5%
27%
22%
19%
14%
98%
6.5%
2.1%
0%
4
100 g
300 g
3 oz - 85g 1 piece, cooked (yield from 1 lb raw meat, boneless) - 277g
Magnesium
Magnesium
Calcium
Calcium
Potassium
Potassium
Iron
Iron
Copper
Copper
Zinc
Zinc
Phosphorus
Phosphorus
Sodium
Sodium
Manganese
Manganese
Selenium
Selenium
16%
1.5%
23%
402%
49%
280%
73%
9.3%
0%
61%
Vitamin Comparison
Vitamin comparison score is based on the number of vitamins by which one or the other food is richer. The "coverage" charts below show how much of the daily needs can be covered by 300 grams of the food.
5
100 g
300 g
4 oz - 113g 1 breast - 219g 1 bird - 627g
Vitamin C
Vit. C
Vitamin D
Vit. D
Vitamin A
Vit. A
Vitamin E
Vit. E
Vitamin B1
Vit. B1
Vitamin B2
Vit. B2
Vitamin B3
Vit. B3
Vitamin B5
Vit. B5
Vitamin B6
Vit. B6
Vitamin B12
Vit. B12
Vitamin K
Vit. K
Folate
Folate
0%
0%
1.7%
15%
11%
65%
218%
0%
294%
363%
0%
0%
4
100 g
300 g
3 oz - 85g 1 piece, cooked (yield from 1 lb raw meat, boneless) - 277g
Vitamin C
Vit. C
Vitamin D
Vit. D
Vitamin A
Vit. A
Vitamin E
Vit. E
Vitamin B1
Vit. B1
Vitamin B2
Vit. B2
Vitamin B3
Vit. B3
Vitamin B5
Vit. B5
Vitamin B6
Vit. B6
Vitamin B12
Vit. B12
Vitamin K
Vit. K
Folate
Folate
0%
0%
0%
9.8%
25%
189%
63%
0%
67%
309%
4.5%
4.5%
All nutrients comparison - raw data values
Nutrient
DV% diff.
Iron
0.58mg
10.73mg
127%
Zinc
0.51mg
10.27mg
89%
Vitamin B6
1.275mg
0.29mg
76%
Vitamin B3
11.6mg
3.35mg
52%
Vitamin B2
0.28mg
0.82mg
42%
Choline
122.3mg
22%
Selenium
11.2µg
20%
Fats
0.88g
13.39g
19%
Cholesterol
40mg
98mg
19%
Vitamin B12
2.9µg
2.47µg
18%
Saturated fat
0.13g
3.54g
16%
Polyunsaturated fat
0.132g
2.4g
15%
Monounsaturated fat
0.042g
5.66g
14%
Protein
25.94g
32.42g
13%
Copper
0.058mg
0.148mg
10%
Phosphorus
229mg
170mg
8%
Calories
112kcal
259kcal
7%
Vitamin B1
0.042mg
0.1mg
5%
Magnesium
32mg
23mg
2%
Vitamin E
0.73mg
0.49mg
2%
Vitamin K
1.8µg
2%
Folate
6µg
2%
Potassium
311mg
263mg
1%
Sodium
50mg
71mg
1%
Vitamin A
5µg
0µg
1%
Manganese
0.016mg
1%
Protein per 100 calories
23g
13g
N/A
Calories per 10 g protein
43kcal
80kcal
N/A
Weight per 100 calories
89g
39g
N/A
Unsaturated / Saturated Fat ratio
1.3
2.3
N/A
Calcium
5mg
5mg
0%
Omega-3 - EPA
0.003g
0g
N/A
Omega-3 - DHA
0.009g
0.037g
N/A
Omega-3 - ALA
0.008g
N/A
Omega-3 - DPA
0.008g
0.034g
N/A
Omega-6 - Dihomo-gamma-linoleic acid
0.001g
N/A
Omega-6 - Eicosadienoic acid
0.001g
N/A
Omega-6 - Linoleic acid
0.071g
N/A
Macronutrient Comparison
Macronutrient breakdown side-by-side comparison
1
26%
73%
Protein:
25.94 g
Fats:
0.88 g
Carbs:
0 g
Water:
72.93 g
Other:
0.25 g
3
32%
13%
54%
Protein:
32.42 g
Fats:
13.39 g
Carbs:
0 g
Water:
53.55 g
Other:
0.64 g
Contains
more
Water Water
+36.2%
Contains
more
Protein Protein
+25%
Contains
more
Fats Fats
+1421.6%
Contains
more
Other Other
+156%
Fat Type Comparison
Fat type breakdown side-by-side comparison
1
43%
14%
43%
Saturated fat:
Sat. Fat
0.13 g
Monounsaturated fat:
Mono. Fat
0.042 g
Polyunsaturated fat:
Poly. Fat
0.132 g
2
31%
49%
21%
Saturated fat:
Sat. Fat
3.54 g
Monounsaturated fat:
Mono. Fat
5.66 g
Polyunsaturated fat:
Poly. Fat
2.4 g
Contains
less
Sat. Fat Saturated fat
-96.3%
Contains
more
Mono. Fat Monounsaturated fat
+13376.2%
Contains
more
Poly. Fat Polyunsaturated fat
+1718.2%