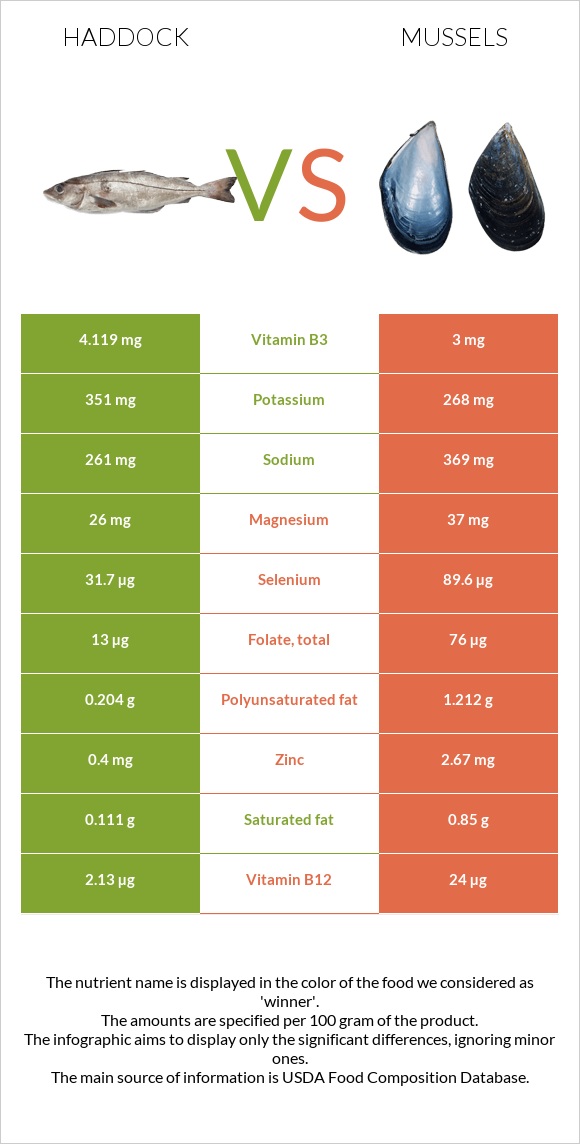
How are haddock and mussels different? Haddock is higher in vitamin B6; however, mussels is richer in vitamin B12, manganese, selenium, iron, vitamin B2, vitamin B1, zinc, folate, and vitamin C. Daily need coverage for vitamin B12 for mussels is 911% higher. Haddock contains 3 times more vitamin B6 than mussels. While haddock contains 0.327mg of vitamin B6, mussels contains only 0.1mg. Haddock has a lower glycemic index (0) than mussels (50). Fish, haddock, cooked, dry heat and Mollusks, mussel, blue, cooked, moist heat are the varieties used in this article.
Infographic
Mineral Comparison
Mineral comparison score is based on the number of minerals by which one or the other food is richer. The "coverage" charts below show how much of the daily needs can be covered by 300 grams of the food.
2
100 g
300 g
3 oz - 85g 1 fillet - 150g
Magnesium
Magnesium
Calcium
Calcium
Potassium
Potassium
Iron
Iron
Copper
Copper
Zinc
Zinc
Phosphorus
Phosphorus
Sodium
Sodium
Manganese
Manganese
Selenium
Selenium
19%
4.2%
31%
7.9%
8.7%
11%
119%
34%
1.7%
173%
7
100 g
300 g
3 oz - 85g
Magnesium
Magnesium
Calcium
Calcium
Potassium
Potassium
Iron
Iron
Copper
Copper
Zinc
Zinc
Phosphorus
Phosphorus
Sodium
Sodium
Manganese
Manganese
Selenium
Selenium
26%
9.9%
24%
252%
50%
73%
122%
48%
887%
489%
Vitamin Comparison
Vitamin comparison score is based on the number of vitamins by which one or the other food is richer. The "coverage" charts below show how much of the daily needs can be covered by 300 grams of the food.
5
100 g
300 g
3 oz - 85g 1 fillet - 150g
Vitamin C
Vit. C
Vitamin D
Vit. D
Vitamin A
Vit. A
Vitamin E
Vit. E
Vitamin B1
Vit. B1
Vitamin B2
Vit. B2
Vitamin B3
Vit. B3
Vitamin B5
Vit. B5
Vitamin B6
Vit. B6
Vitamin B12
Vit. B12
Vitamin K
Vit. K
Folate
Folate
0%
9%
7%
11%
5.8%
16%
77%
30%
75%
266%
0.25%
9.8%
7
100 g
300 g
3 oz - 85g
Vitamin C
Vit. C
Vitamin D
Vit. D
Vitamin A
Vit. A
Vitamin E
Vit. E
Vitamin B1
Vit. B1
Vitamin B2
Vit. B2
Vitamin B3
Vit. B3
Vitamin B5
Vit. B5
Vitamin B6
Vit. B6
Vitamin B12
Vit. B12
Vitamin K
Vit. K
Folate
Folate
45%
0%
30%
0%
75%
97%
56%
57%
23%
3000%
0%
57%
All nutrients comparison - raw data values
Nutrient
DV% diff.
Vitamin B12
2.13µg
24µg
911%
Manganese
0.013mg
6.8mg
295%
Selenium
31.7µg
89.6µg
105%
Iron
0.21mg
6.72mg
81%
Vitamin B2
0.069mg
0.42mg
27%
Vitamin B1
0.023mg
0.3mg
23%
Zinc
0.4mg
2.67mg
21%
Vitamin B6
0.327mg
0.1mg
17%
Folate
13µg
76µg
16%
Vitamin C
0mg
13.6mg
15%
Copper
0.026mg
0.149mg
14%
Choline
79.6mg
14%
Vitamin B5
0.494mg
0.95mg
9%
Protein
19.99g
23.8g
8%
Vitamin A
21µg
91µg
8%
Vitamin B3
4.119mg
3mg
7%
Polyunsaturated fat
0.204g
1.212g
7%
Fats
0.55g
4.48g
6%
Sodium
261mg
369mg
5%
Calories
90kcal
172kcal
4%
Vitamin E
0.55mg
4%
Cholesterol
66mg
56mg
3%
Vitamin D*
23 IU
3%
Vitamin D
0.6µg
3%
Magnesium
26mg
37mg
3%
Saturated fat
0.111g
0.85g
3%
Carbs
0g
7.39g
2%
Calcium
14mg
33mg
2%
Potassium
351mg
268mg
2%
Monounsaturated fat
0.074g
1.014g
2%
Phosphorus
278mg
285mg
1%
Protein per 100 calories
22g
14g
N/A
Calories per 10 g protein
45kcal
72kcal
N/A
Weight per 100 calories
111g
58g
N/A
Unsaturated / Saturated Fat ratio
2.5
2.6
N/A
Net carbs
0g
7.39g
N/A
Vitamin K
0.1µg
0%
Trans fat
0.005g
N/A
Tryptophan
0.26mg
0.267mg
0%
Threonine
1.015mg
1.025mg
0%
Isoleucine
1.067mg
1.036mg
0%
Leucine
1.882mg
1.676mg
0%
Lysine
2.126mg
1.779mg
0%
Methionine
0.686mg
0.537mg
0%
Phenylalanine
0.904mg
0.853mg
0%
Valine
1.193mg
1.04mg
0%
Histidine
0.682mg
0.457mg
0%
Omega-3 - EPA
0.051g
0.276g
N/A
Omega-3 - DHA
0.109g
0.506g
N/A
Omega-3 - DPA
0.006g
0.044g
N/A
Omega-6 - Eicosadienoic acid
0.001g
N/A
Macronutrient Comparison
Macronutrient breakdown side-by-side comparison
1
20%
79%
Protein:
19.99 g
Fats:
0.55 g
Carbs:
0 g
Water:
79.65 g
Other:
0 g
4
24%
4%
7%
61%
3%
Protein:
23.8 g
Fats:
4.48 g
Carbs:
7.39 g
Water:
61.15 g
Other:
3.18 g
Contains
more
Water Water
+30.3%
Contains
more
Protein Protein
+19.1%
Contains
more
Fats Fats
+714.5%
Contains
more
Carbs Carbs
+∞%
Contains
more
Other Other
+∞%
Fat Type Comparison
Fat type breakdown side-by-side comparison
1
29%
19%
52%
Saturated fat:
Sat. Fat
0.111 g
Monounsaturated fat:
Mono. Fat
0.074 g
Polyunsaturated fat:
Poly. Fat
0.204 g
2
28%
33%
39%
Saturated fat:
Sat. Fat
0.85 g
Monounsaturated fat:
Mono. Fat
1.014 g
Polyunsaturated fat:
Poly. Fat
1.212 g
Contains
less
Sat. Fat Saturated fat
-86.9%
Contains
more
Mono. Fat Monounsaturated fat
+1270.3%
Contains
more
Poly. Fat Polyunsaturated fat
+494.1%