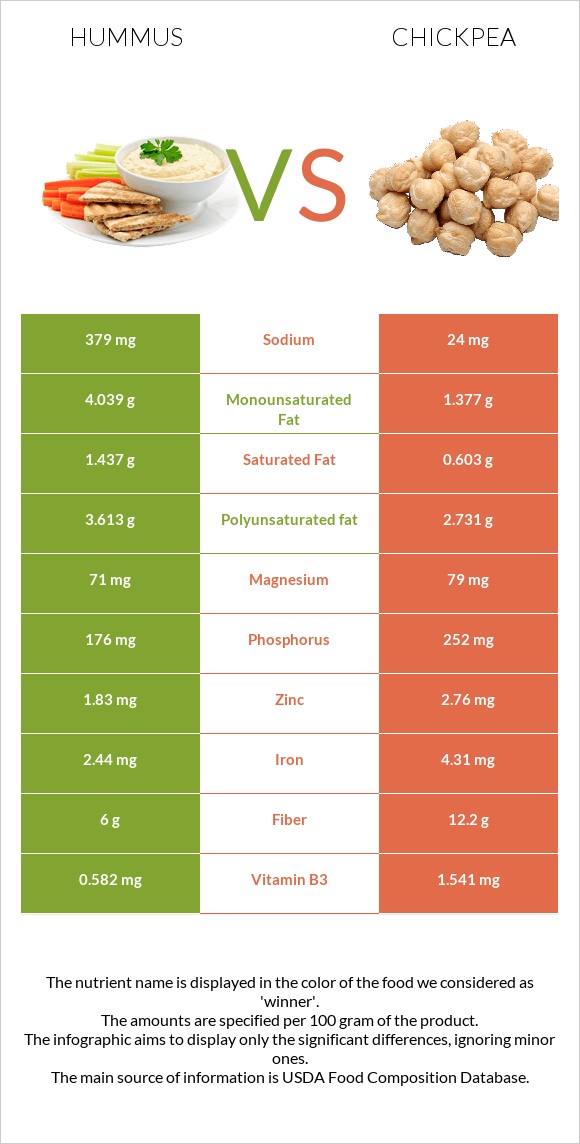
A recap on the differences between hummus and chickpeas Hummus is higher in copper, magnesium, and vitamin B1, yet chickpeas are higher in folate, manganese, fiber, and iron. Chickpeas cover your daily folate needs 22% more than hummus. Hummus contains 54 times more sodium than chickpeas. While hummus contains 379mg of sodium, chickpeas contain only 7mg. The glycemic index of hummus is lower. Food varieties used in this article are Hummus, commercial and Chickpeas (garbanzo beans, bengal gram), mature seeds, cooked, boiled, without salt .
Infographic
Mineral Comparison
Mineral comparison score is based on the number of minerals by which one or the other food is richer. The "coverage" charts below show how much of the daily needs can be covered by 300 grams of the food.
3
100 g
300 g
1 tbsp - 15g 1 cup - 246g
Magnesium
Magnesium
Calcium
Calcium
Potassium
Potassium
Iron
Iron
Copper
Copper
Zinc
Zinc
Phosphorus
Phosphorus
Sodium
Sodium
Manganese
Manganese
Selenium
Selenium
51%
11%
20%
92%
176%
50%
75%
49%
101%
14%
6
100 g
300 g
1 cup - 164g
Magnesium
Magnesium
Calcium
Calcium
Potassium
Potassium
Iron
Iron
Copper
Copper
Zinc
Zinc
Phosphorus
Phosphorus
Sodium
Sodium
Manganese
Manganese
Selenium
Selenium
34%
15%
26%
108%
117%
42%
72%
0.91%
134%
20%
Vitamin Comparison
Vitamin comparison score is based on the number of vitamins by which one or the other food is richer. The "coverage" charts below show how much of the daily needs can be covered by 300 grams of the food.
2
100 g
300 g
1 tbsp - 15g 1 cup - 246g
Vitamin C
Vit. C
Vitamin D
Vit. D
Vitamin A
Vit. A
Vitamin E
Vit. E
Vitamin B1
Vit. B1
Vitamin B2
Vit. B2
Vitamin B3
Vit. B3
Vitamin B5
Vit. B5
Vitamin B6
Vit. B6
Vitamin B12
Vit. B12
Vitamin K
Vit. K
Folate
Folate
0%
0%
0%
0%
45%
15%
11%
7.9%
46%
0%
0%
62%
6
100 g
300 g
1 cup - 164g
Vitamin C
Vit. C
Vitamin D
Vit. D
Vitamin A
Vit. A
Vitamin E
Vit. E
Vitamin B1
Vit. B1
Vitamin B2
Vit. B2
Vitamin B3
Vit. B3
Vitamin B5
Vit. B5
Vitamin B6
Vit. B6
Vitamin B12
Vit. B12
Vitamin K
Vit. K
Folate
Folate
4.3%
0%
0.33%
7%
29%
15%
9.9%
17%
32%
0%
10%
129%
All nutrients comparison - raw data values
Nutrient
DV% diff.
Folate
83µg
172µg
22%
Copper
0.527mg
0.352mg
19%
Sodium
379mg
7mg
16%
Polyunsaturated fat
3.613g
1.156g
16%
Fats
9.6g
2.59g
11%
Manganese
0.773mg
1.03mg
11%
Monounsaturated fat
4.039g
0.583g
9%
Choline
42.8mg
8%
Iron
2.44mg
2.89mg
6%
Fiber
6g
7.6g
6%
Magnesium
71mg
48mg
5%
Vitamin B1
0.18mg
0.116mg
5%
Vitamin B6
0.2mg
0.139mg
5%
Saturated fat
1.437g
0.269g
5%
Carbs
14.29g
27.42g
4%
Zinc
1.83mg
1.53mg
3%
Vitamin B5
0.132mg
0.286mg
3%
Vitamin K
4µg
3%
Protein
7.9g
8.86g
2%
Potassium
228mg
291mg
2%
Vitamin E
0.35mg
2%
Selenium
2.6µg
3.7µg
2%
Vitamin C
0mg
1.3mg
1%
Calcium
38mg
49mg
1%
Phosphorus
176mg
168mg
1%
Calories
166kcal
164kcal
0%
Protein per 100 calories
4.8g
5.4g
N/A
Calories per 10 g protein
210kcal
185kcal
N/A
Weight per 100 calories
60g
61g
N/A
Unsaturated / Saturated Fat ratio
5.3
6.5
N/A
Net carbs
8.29g
19.82g
N/A
Sugar
4.8g
N/A
Vitamin A
1µg
0%
Vitamin B2
0.064mg
0.063mg
0%
Vitamin B3
0.582mg
0.526mg
0%
Tryptophan
0.085mg
0%
Threonine
0.329mg
0%
Isoleucine
0.38mg
0%
Leucine
0.631mg
0%
Lysine
0.593mg
0%
Methionine
0.116mg
0%
Phenylalanine
0.475mg
0%
Valine
0.372mg
0%
Histidine
0.244mg
0%
Macronutrient Comparison
Macronutrient breakdown side-by-side comparison
3
8%
10%
14%
67%
Protein:
7.9 g
Fats:
9.6 g
Carbs:
14.29 g
Water:
66.59 g
Other:
1.62 g
2
9%
3%
27%
60%
Protein:
8.86 g
Fats:
2.59 g
Carbs:
27.42 g
Water:
60.21 g
Other:
0.92 g
Contains
more
Fats Fats
+270.7%
Contains
more
Other Other
+76.1%
Contains
more
Protein Protein
+12.2%
Contains
more
Carbs Carbs
+91.9%
Fat Type Comparison
Fat type breakdown side-by-side comparison
2
16%
44%
40%
Saturated fat:
Sat. Fat
1.437 g
Monounsaturated fat:
Mono. Fat
4.039 g
Polyunsaturated fat:
Poly. Fat
3.613 g
1
13%
29%
58%
Saturated fat:
Sat. Fat
0.269 g
Monounsaturated fat:
Mono. Fat
0.583 g
Polyunsaturated fat:
Poly. Fat
1.156 g
Contains
more
Mono. Fat Monounsaturated fat
+592.8%
Contains
more
Poly. Fat Polyunsaturated fat
+212.5%
Contains
less
Sat. Fat Saturated fat
-81.3%