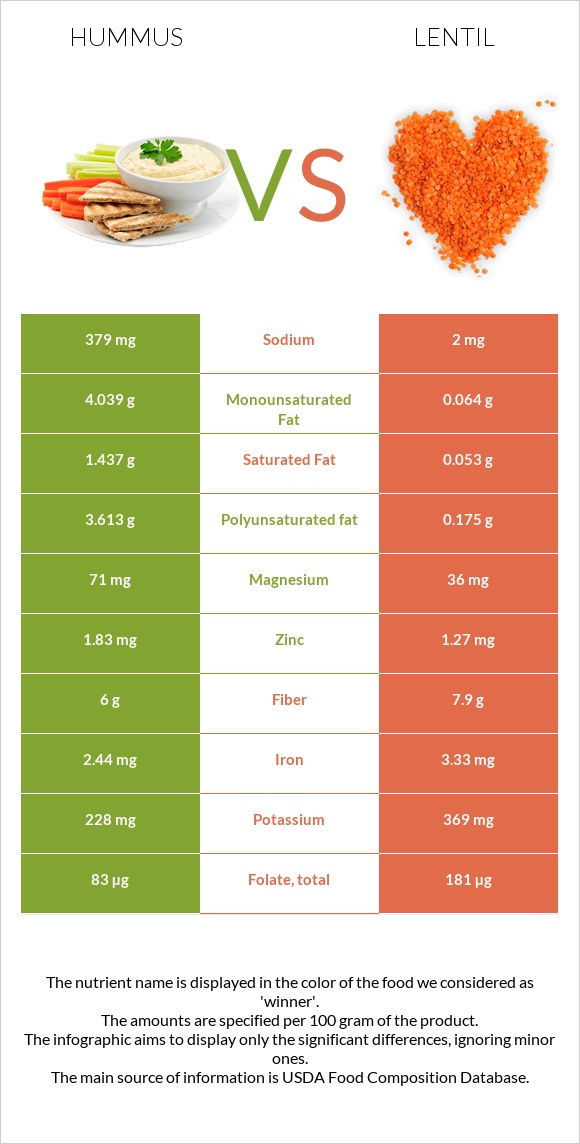
How are hummus and lentil different? Hummus is richer in copper, manganese, magnesium, and zinc, while lentil is higher in folate, iron, vitamin B5, and fiber. Hummus covers your daily need for copper, 31% more than lentil. Hummus contains 190 times more sodium than lentil. Hummus contains 379mg of sodium, while lentil contains 2mg. Lentil has a higher glycemic index (29) than hummus (6). Hummus, commercial and Lentils, mature seeds, cooked, boiled, without salt types were used in this article.
Infographic
Mineral Comparison
Mineral comparison score is based on the number of minerals by which one or the other food is richer. The "coverage" charts below show how much of the daily needs can be covered by 300 grams of the food.
5
100 g
300 g
1 tbsp - 15g 1 cup - 246g
Magnesium
Magnesium
Calcium
Calcium
Potassium
Potassium
Iron
Iron
Copper
Copper
Zinc
Zinc
Phosphorus
Phosphorus
Sodium
Sodium
Manganese
Manganese
Selenium
Selenium
51%
11%
20%
92%
176%
50%
75%
49%
101%
14%
3
100 g
300 g
1 tbsp - 12.3g 1 cup - 198g
Magnesium
Magnesium
Calcium
Calcium
Potassium
Potassium
Iron
Iron
Copper
Copper
Zinc
Zinc
Phosphorus
Phosphorus
Sodium
Sodium
Manganese
Manganese
Selenium
Selenium
26%
5.7%
33%
125%
84%
35%
77%
0.26%
64%
15%
Vitamin Comparison
Vitamin comparison score is based on the number of vitamins by which one or the other food is richer. The "coverage" charts below show how much of the daily needs can be covered by 300 grams of the food.
1
100 g
300 g
1 tbsp - 15g 1 cup - 246g
Vitamin C
Vit. C
Vitamin D
Vit. D
Vitamin A
Vit. A
Vitamin E
Vit. E
Vitamin B1
Vit. B1
Vitamin B2
Vit. B2
Vitamin B3
Vit. B3
Vitamin B5
Vit. B5
Vitamin B6
Vit. B6
Vitamin B12
Vit. B12
Vitamin K
Vit. K
Folate
Folate
0%
0%
0%
0%
45%
15%
11%
7.9%
46%
0%
0%
62%
7
100 g
300 g
1 tbsp - 12.3g 1 cup - 198g
Vitamin C
Vit. C
Vitamin D
Vit. D
Vitamin A
Vit. A
Vitamin E
Vit. E
Vitamin B1
Vit. B1
Vitamin B2
Vit. B2
Vitamin B3
Vit. B3
Vitamin B5
Vit. B5
Vitamin B6
Vit. B6
Vitamin B12
Vit. B12
Vitamin K
Vit. K
Folate
Folate
5%
0%
0%
2.2%
42%
17%
20%
38%
41%
0%
4.3%
136%
All nutrients comparison - raw data values
Nutrient
DV% diff.
Copper
0.527mg
0.251mg
31%
Folate
83µg
181µg
25%
Polyunsaturated fat
3.613g
0.175g
23%
Sodium
379mg
2mg
16%
Fats
9.6g
0.38g
14%
Manganese
0.773mg
0.494mg
12%
Iron
2.44mg
3.33mg
11%
Vitamin B5
0.132mg
0.638mg
10%
Monounsaturated fat
4.039g
0.064g
10%
Magnesium
71mg
36mg
8%
Fiber
6g
7.9g
8%
Choline
32.7mg
6%
Saturated fat
1.437g
0.053g
6%
Zinc
1.83mg
1.27mg
5%
Potassium
228mg
369mg
4%
Calories
166kcal
116kcal
3%
Vitamin B3
0.582mg
1.06mg
3%
Protein
7.9g
9.02g
2%
Vitamin C
0mg
1.5mg
2%
Carbs
14.29g
20.13g
2%
Calcium
38mg
19mg
2%
Vitamin B6
0.2mg
0.178mg
2%
Phosphorus
176mg
180mg
1%
Vitamin E
0.11mg
1%
Vitamin B1
0.18mg
0.169mg
1%
Vitamin B2
0.064mg
0.073mg
1%
Vitamin K
1.7µg
1%
Protein per 100 calories
4.8g
7.8g
N/A
Calories per 10 g protein
210kcal
129kcal
N/A
Weight per 100 calories
60g
86g
N/A
Unsaturated / Saturated Fat ratio
5.3
4.5
N/A
Net carbs
8.29g
12.23g
N/A
Sugar
1.8g
N/A
Selenium
2.6µg
2.8µg
0%
Tryptophan
0.081mg
0%
Threonine
0.323mg
0%
Isoleucine
0.39mg
0%
Leucine
0.654mg
0%
Lysine
0.63mg
0%
Methionine
0.077mg
0%
Phenylalanine
0.445mg
0%
Valine
0.448mg
0%
Histidine
0.254mg
0%
Macronutrient Comparison
Macronutrient breakdown side-by-side comparison
2
8%
10%
14%
67%
Protein:
7.9 g
Fats:
9.6 g
Carbs:
14.29 g
Water:
66.59 g
Other:
1.62 g
3
9%
20%
70%
Protein:
9.02 g
Fats:
0.38 g
Carbs:
20.13 g
Water:
69.64 g
Other:
0.83 g
Contains
more
Fats Fats
+2426.3%
Contains
more
Other Other
+95.2%
Contains
more
Protein Protein
+14.2%
Contains
more
Carbs Carbs
+40.9%
Fat Type Comparison
Fat type breakdown side-by-side comparison
2
16%
44%
40%
Saturated fat:
Sat. Fat
1.437 g
Monounsaturated fat:
Mono. Fat
4.039 g
Polyunsaturated fat:
Poly. Fat
3.613 g
1
18%
22%
60%
Saturated fat:
Sat. Fat
0.053 g
Monounsaturated fat:
Mono. Fat
0.064 g
Polyunsaturated fat:
Poly. Fat
0.175 g
Contains
more
Mono. Fat Monounsaturated fat
+6210.9%
Contains
more
Poly. Fat Polyunsaturated fat
+1964.6%
Contains
less
Sat. Fat Saturated fat
-96.3%