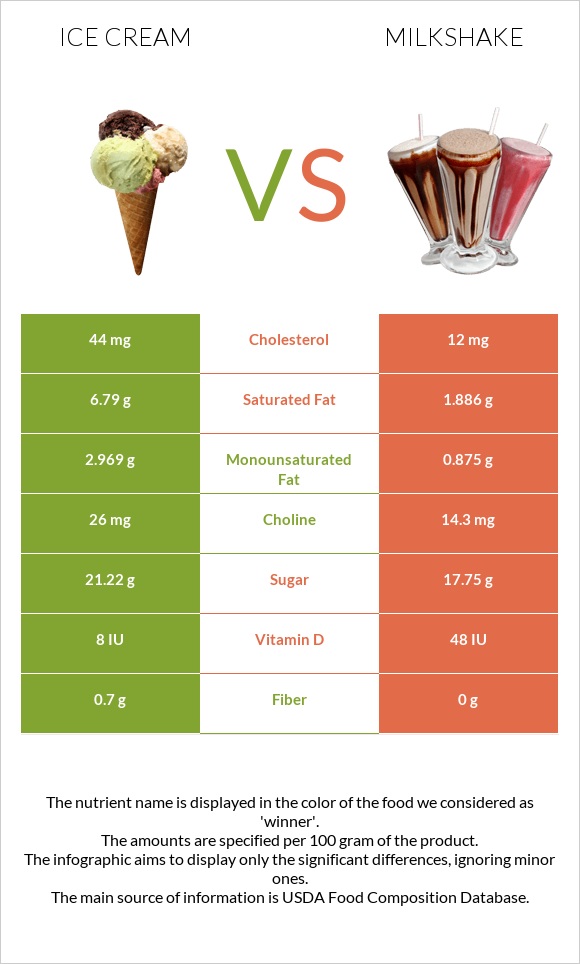
What are the main differences between ice cream and milkshake? Ice cream is richer in vitamin A and monounsaturated fat, yet milkshake is richer in vitamin B12. Ice cream's daily need coverage for saturated fat is 25% higher. Milkshake contains less cholesterol. Milkshake has a lower glycemic index than ice cream. We used Ice creams, vanilla and Milk shakes, thick vanilla types in this comparison.
Infographic
Mineral Comparison
Mineral comparison score is based on the number of minerals by which one or the other food is richer. The "coverage" charts below show how much of the daily needs can be covered by 300 grams of the food.
3
100 g
300 g
1 serving 1/2 cup - 66g
Magnesium
Magnesium
Calcium
Calcium
Potassium
Potassium
Iron
Iron
Copper
Copper
Zinc
Zinc
Phosphorus
Phosphorus
Sodium
Sodium
Manganese
Manganese
Selenium
Selenium
10%
38%
18%
3.4%
7.7%
19%
45%
10%
1%
9.8%
5
100 g
300 g
1 fl oz - 28.4g 1 container (11 oz) - 313g
Magnesium
Magnesium
Calcium
Calcium
Potassium
Potassium
Iron
Iron
Copper
Copper
Zinc
Zinc
Phosphorus
Phosphorus
Sodium
Sodium
Manganese
Manganese
Selenium
Selenium
8.6%
44%
16%
3.8%
17%
11%
49%
12%
1.8%
13%
Vitamin Comparison
Vitamin comparison score is based on the number of vitamins by which one or the other food is richer. The "coverage" charts below show how much of the daily needs can be covered by 300 grams of the food.
8
100 g
300 g
1 serving 1/2 cup - 66g
Vitamin C
Vit. C
Vitamin D
Vit. D
Vitamin A
Vit. A
Vitamin E
Vit. E
Vitamin B1
Vit. B1
Vitamin B2
Vit. B2
Vitamin B3
Vit. B3
Vitamin B5
Vit. B5
Vitamin B6
Vit. B6
Vitamin B12
Vit. B12
Vitamin K
Vit. K
Folate
Folate
2%
3%
39%
6%
10%
55%
2.2%
35%
11%
49%
0.75%
3.8%
4
100 g
300 g
1 fl oz - 28.4g 1 container (11 oz) - 313g
Vitamin C
Vit. C
Vitamin D
Vit. D
Vitamin A
Vit. A
Vitamin E
Vit. E
Vitamin B1
Vit. B1
Vitamin B2
Vit. B2
Vitamin B3
Vit. B3
Vitamin B5
Vit. B5
Vitamin B6
Vit. B6
Vitamin B12
Vit. B12
Vitamin K
Vit. K
Folate
Folate
0%
18%
8.3%
1%
7.5%
45%
2.7%
22%
9.7%
65%
0.5%
5.3%
All nutrients comparison - raw data values
Nutrient
DV% diff.
Saturated fat
6.79g
1.886g
22%
Fats
11g
3.03g
12%
Cholesterol
44mg
12mg
11%
Vitamin A
118µg
25µg
10%
Calories
207kcal
112kcal
5%
Vitamin D*
8 IU
48 IU
5%
Vitamin D
0.2µg
1.2µg
5%
Vitamin B12
0.39µg
0.52µg
5%
Monounsaturated fat
2.969g
0.875g
5%
Vitamin B5
0.581mg
0.368mg
4%
Fiber
0.7g
0g
3%
Copper
0.023mg
0.051mg
3%
Zinc
0.69mg
0.39mg
3%
Vitamin B2
0.24mg
0.195mg
3%
Carbs
23.6g
17.75g
2%
Calcium
128mg
146mg
2%
Vitamin E
0.3mg
0.05mg
2%
Choline
26mg
14.3mg
2%
Polyunsaturated fat
0.452g
0.113g
2%
Protein
3.5g
3.86g
1%
Vitamin C
0.6mg
0mg
1%
Phosphorus
105mg
115mg
1%
Sodium
80mg
95mg
1%
Selenium
1.8µg
2.3µg
1%
Vitamin B1
0.041mg
0.03mg
1%
Folate
5µg
7µg
1%
Protein per 100 calories
1.7g
3.4g
N/A
Calories per 10 g protein
591kcal
290kcal
N/A
Weight per 100 calories
48g
89g
N/A
Unsaturated / Saturated Fat ratio
0.5
0.52
N/A
Net carbs
22.9g
17.75g
N/A
Magnesium
14mg
12mg
0%
Potassium
199mg
183mg
0%
Iron
0.09mg
0.1mg
0%
Sugar
21.22g
17.75g
N/A
Manganese
0.008mg
0.014mg
0%
Vitamin B3
0.116mg
0.146mg
0%
Vitamin B6
0.048mg
0.042mg
0%
Vitamin K
0.3µg
0.2µg
0%
Tryptophan
0.045mg
0.054mg
0%
Threonine
0.146mg
0.174mg
0%
Isoleucine
0.195mg
0.234mg
0%
Leucine
0.316mg
0.378mg
0%
Lysine
0.258mg
0.306mg
0%
Methionine
0.081mg
0.097mg
0%
Phenylalanine
0.157mg
0.186mg
0%
Valine
0.217mg
0.258mg
0%
Histidine
0.088mg
0.105mg
0%
Omega-3 - EPA
0.003g
0g
N/A
Macronutrient Comparison
Macronutrient breakdown side-by-side comparison
2
4%
11%
24%
61%
Protein:
3.5 g
Fats:
11 g
Carbs:
23.6 g
Water:
61 g
Other:
0.9 g
3
4%
3%
18%
74%
Protein:
3.86 g
Fats:
3.03 g
Carbs:
17.75 g
Water:
74.45 g
Other:
0.91 g
Contains
more
Fats Fats
+263%
Contains
more
Carbs Carbs
+33%
Contains
more
Protein Protein
+10.3%
Contains
more
Water Water
+22%
Fat Type Comparison
Fat type breakdown side-by-side comparison
2
66%
29%
4%
Saturated fat:
Sat. Fat
6.79 g
Monounsaturated fat:
Mono. Fat
2.969 g
Polyunsaturated fat:
Poly. Fat
0.452 g
1
66%
30%
4%
Saturated fat:
Sat. Fat
1.886 g
Monounsaturated fat:
Mono. Fat
0.875 g
Polyunsaturated fat:
Poly. Fat
0.113 g
Contains
more
Mono. Fat Monounsaturated fat
+239.3%
Contains
more
Poly. Fat Polyunsaturated fat
+300%
Contains
less
Sat. Fat Saturated fat
-72.2%