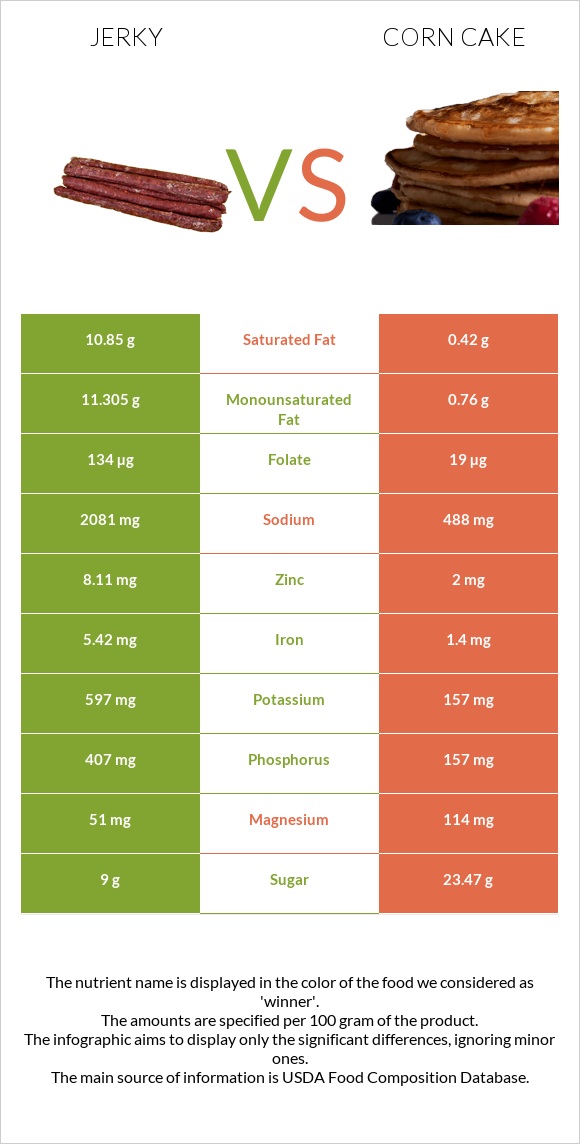
Differences between jerky and corn cake Jerky has more zinc, iron, vitamin B12, phosphorus, and folate, while corn cake has more manganese, copper, and vitamin B3. Corn cake's daily need coverage for manganese is 74% higher. The amount of saturated fat in corn cake is lower. Jerky has a lower glycemic index. The glycemic index of jerky is 0, while the glycemic index of corn cake is 87. The food types used in this comparison are Snacks, beef jerky, chopped, and formed and Snacks, corn cakes .
Infographic
Mineral Comparison
Mineral comparison score is based on the number of minerals by which one or the other food is richer. The "coverage" charts below show how much of the daily needs can be covered by 300 grams of the food.
4
100 g
300 g
1 piece, large - 20g 1 oz - 28.35g 1 oz - 28.35g
Magnesium
Magnesium
Calcium
Calcium
Potassium
Potassium
Iron
Iron
Copper
Copper
Zinc
Zinc
Phosphorus
Phosphorus
Sodium
Sodium
Manganese
Manganese
Selenium
Selenium
36%
6%
53%
203%
76%
221%
174%
271%
14%
58%
4
100 g
300 g
1 cake - 9g 2 cakes - 18g
Magnesium
Magnesium
Calcium
Calcium
Potassium
Potassium
Iron
Iron
Copper
Copper
Zinc
Zinc
Phosphorus
Phosphorus
Sodium
Sodium
Manganese
Manganese
Selenium
Selenium
81%
5.7%
14%
53%
140%
55%
67%
64%
237%
54%
Vitamin Comparison
Vitamin comparison score is based on the number of vitamins by which one or the other food is richer. The "coverage" charts below show how much of the daily needs can be covered by 300 grams of the food.
7
100 g
300 g
1 piece, large - 20g 1 oz - 28.35g 1 oz - 28.35g
Vitamin C
Vit. C
Vitamin D
Vit. D
Vitamin A
Vit. A
Vitamin E
Vit. E
Vitamin B1
Vit. B1
Vitamin B2
Vit. B2
Vitamin B3
Vit. B3
Vitamin B5
Vit. B5
Vitamin B6
Vit. B6
Vitamin B12
Vit. B12
Vitamin K
Vit. K
Folate
Folate
0%
4.5%
0%
9.8%
39%
33%
32%
9.8%
41%
124%
5.8%
101%
4
100 g
300 g
1 cake - 9g 2 cakes - 18g
Vitamin C
Vit. C
Vitamin D
Vit. D
Vitamin A
Vit. A
Vitamin E
Vit. E
Vitamin B1
Vit. B1
Vitamin B2
Vit. B2
Vitamin B3
Vit. B3
Vitamin B5
Vit. B5
Vitamin B6
Vit. B6
Vitamin B12
Vit. B12
Vitamin K
Vit. K
Folate
Folate
0%
0%
23%
0%
63%
12%
97%
50%
32%
0%
0%
14%
All nutrients comparison - raw data values
Nutrient
DV% diff.
Manganese
0.111mg
1.815mg
74%
Sodium
2081mg
488mg
69%
Zinc
8.11mg
2mg
56%
Protein
33.2g
8.1g
50%
Iron
5.42mg
1.4mg
50%
Saturated fat
10.85g
0.42g
47%
Vitamin B12
0.99µg
0µg
41%
Fats
25.6g
2.4g
36%
Phosphorus
407mg
157mg
36%
Folate
134µg
19µg
29%
Monounsaturated fat
11.305g
0.76g
26%
Carbs
11g
83.4g
24%
Copper
0.227mg
0.42mg
21%
Vitamin B3
1.732mg
5.15mg
21%
Choline
109.1mg
20%
Cholesterol
48mg
0mg
16%
Magnesium
51mg
114mg
15%
Potassium
597mg
157mg
13%
Vitamin B5
0.163mg
0.83mg
13%
Vitamin A
0µg
70µg
8%
Vitamin B1
0.154mg
0.25mg
8%
Vitamin B2
0.142mg
0.05mg
7%
Vitamin E
0.49mg
3%
Vitamin B6
0.179mg
0.14mg
3%
Vitamin D
0.3µg
2%
Vitamin K
2.3µg
0µg
2%
Calories
410kcal
387kcal
1%
Vitamin D*
11 IU
1%
Selenium
10.7µg
9.9µg
1%
Polyunsaturated fat
1.011g
0.93g
1%
Protein per 100 calories
8.1g
2.1g
N/A
Calories per 10 g protein
123kcal
478kcal
N/A
Weight per 100 calories
24g
26g
N/A
Unsaturated / Saturated Fat ratio
1.1
4
N/A
Net carbs
9.2g
81.5g
N/A
Calcium
20mg
19mg
0%
Sugar
9g
23.47g
N/A
Fiber
1.8g
1.9g
0%
Tryptophan
0.081mg
0%
Threonine
0.301mg
0%
Isoleucine
0.316mg
0%
Leucine
0.837mg
0%
Lysine
0.267mg
0%
Methionine
0.177mg
0%
Phenylalanine
0.408mg
0%
Valine
0.442mg
0%
Histidine
0.227mg
0%
Macronutrient Comparison
Macronutrient breakdown side-by-side comparison
4
33%
26%
11%
23%
7%
Protein:
33.2 g
Fats:
25.6 g
Carbs:
11 g
Water:
23.36 g
Other:
6.84 g
1
8%
2%
83%
5%
Protein:
8.1 g
Fats:
2.4 g
Carbs:
83.4 g
Water:
4.6 g
Other:
1.5 g
Contains
more
Protein Protein
+309.9%
Contains
more
Fats Fats
+966.7%
Contains
more
Water Water
+407.8%
Contains
more
Other Other
+356%
Contains
more
Carbs Carbs
+658.2%
Fat Type Comparison
Fat type breakdown side-by-side comparison
2
47%
49%
4%
Saturated fat:
Sat. Fat
10.85 g
Monounsaturated fat:
Mono. Fat
11.305 g
Polyunsaturated fat:
Poly. Fat
1.011 g
1
20%
36%
44%
Saturated fat:
Sat. Fat
0.42 g
Monounsaturated fat:
Mono. Fat
0.76 g
Polyunsaturated fat:
Poly. Fat
0.93 g
Contains
more
Mono. Fat Monounsaturated fat
+1387.5%
Contains
less
Sat. Fat Saturated fat
-96.1%
~equal in
Polyunsaturated fat
~0.93g