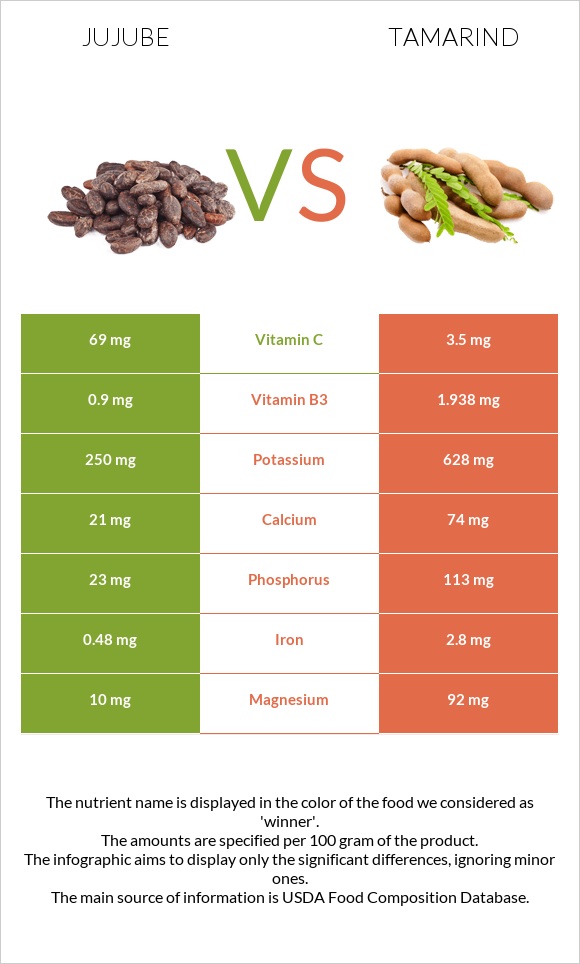
How are jujube and tamarind different? Jujube is richer in vitamin C, while tamarind is higher in vitamin B1, iron, magnesium, phosphorus, potassium, vitamin B2, vitamin B3, and calcium. Jujube covers your daily need for vitamin C, 73% more than tamarind. Jujube, raw and Tamarinds, raw types were used in this article.
Infographic
Mineral Comparison
Mineral comparison score is based on the number of minerals by which one or the other food is richer. The "coverage" charts below show how much of the daily needs can be covered by 300 grams of the food.
2
100 g
300 g
Magnesium
Magnesium
Calcium
Calcium
Potassium
Potassium
Iron
Iron
Copper
Copper
Zinc
Zinc
Phosphorus
Phosphorus
Sodium
Sodium
Manganese
Manganese
Selenium
Selenium
7.1%
6.3%
22%
18%
24%
1.4%
9.9%
0.39%
11%
0%
8
100 g
300 g
1 fruit (3" x 1") - 2g 1 cup, pulp - 120g
Magnesium
Magnesium
Calcium
Calcium
Potassium
Potassium
Iron
Iron
Copper
Copper
Zinc
Zinc
Phosphorus
Phosphorus
Sodium
Sodium
Manganese
Manganese
Selenium
Selenium
66%
22%
55%
105%
29%
2.7%
48%
3.7%
0%
7.1%
Vitamin Comparison
Vitamin comparison score is based on the number of vitamins by which one or the other food is richer. The "coverage" charts below show how much of the daily needs can be covered by 300 grams of the food.
2
100 g
300 g
Vitamin C
Vit. C
Vitamin D
Vit. D
Vitamin A
Vit. A
Vitamin E
Vit. E
Vitamin B1
Vit. B1
Vitamin B2
Vit. B2
Vitamin B3
Vit. B3
Vitamin B5
Vit. B5
Vitamin B6
Vit. B6
Vitamin B12
Vit. B12
Vitamin K
Vit. K
Folate
Folate
230%
0%
0.67%
0%
5%
9.2%
17%
0%
19%
0%
0%
0%
7
100 g
300 g
1 fruit (3" x 1") - 2g 1 cup, pulp - 120g
Vitamin C
Vit. C
Vitamin D
Vit. D
Vitamin A
Vit. A
Vitamin E
Vit. E
Vitamin B1
Vit. B1
Vitamin B2
Vit. B2
Vitamin B3
Vit. B3
Vitamin B5
Vit. B5
Vitamin B6
Vit. B6
Vitamin B12
Vit. B12
Vitamin K
Vit. K
Folate
Folate
12%
0%
0.67%
2%
107%
35%
36%
8.6%
15%
0%
7%
11%
All nutrients comparison - raw data values
Nutrient
DV% diff.
Vitamin C
69mg
3.5mg
73%
Vitamin B1
0.02mg
0.428mg
34%
Iron
0.48mg
2.8mg
29%
Magnesium
10mg
92mg
20%
Fiber
5.1g
20%
Carbs
20.23g
62.5g
14%
Phosphorus
23mg
113mg
13%
Potassium
250mg
628mg
11%
Vitamin B2
0.04mg
0.152mg
9%
Calories
79kcal
239kcal
8%
Vitamin B3
0.9mg
1.938mg
6%
Calcium
21mg
74mg
5%
Manganese
0.084mg
4%
Folate
14µg
4%
Protein
1.2g
2.8g
3%
Vitamin B5
0.143mg
3%
Selenium
1.3µg
2%
Vitamin K
2.8µg
2%
Choline
8.6mg
2%
Fats
0.2g
0.6g
1%
Copper
0.073mg
0.086mg
1%
Sodium
3mg
28mg
1%
Vitamin E
0.1mg
1%
Vitamin B6
0.081mg
0.066mg
1%
Saturated fat
0.272g
1%
Protein per 100 calories
1.5g
1.2g
N/A
Calories per 10 g protein
658kcal
854kcal
N/A
Weight per 100 calories
127g
42g
N/A
Net carbs
20.23g
57.4g
N/A
Sugar
38.8g
N/A
Zinc
0.05mg
0.1mg
0%
Vitamin A
2µg
2µg
0%
Monounsaturated fat
0.181g
0%
Polyunsaturated fat
0.059g
0%
Tryptophan
0.018mg
0%
Lysine
0.139mg
0%
Methionine
0.014mg
0%
Macronutrient Comparison
Macronutrient breakdown side-by-side comparison
1
20%
78%
Protein:
1.2 g
Fats:
0.2 g
Carbs:
20.23 g
Water:
77.86 g
Other:
0.51 g
4
3%
63%
31%
3%
Protein:
2.8 g
Fats:
0.6 g
Carbs:
62.5 g
Water:
31.4 g
Other:
2.7 g
Contains
more
Water Water
+148%
Contains
more
Protein Protein
+133.3%
Contains
more
Fats Fats
+200%
Contains
more
Carbs Carbs
+208.9%
Contains
more
Other Other
+429.4%